
Fig. 6
- ID
- ZDB-IMAGE-190611-61
- Genes
- Antibodies
- Publication
- Taylor et al., 2019 - The microRNA, miR-18a, regulates NeuroD and photoreceptor differentiation in the retina of the zebrafish
- All Figures
- Figures for Taylor et al., 2019
|
Fig. 6
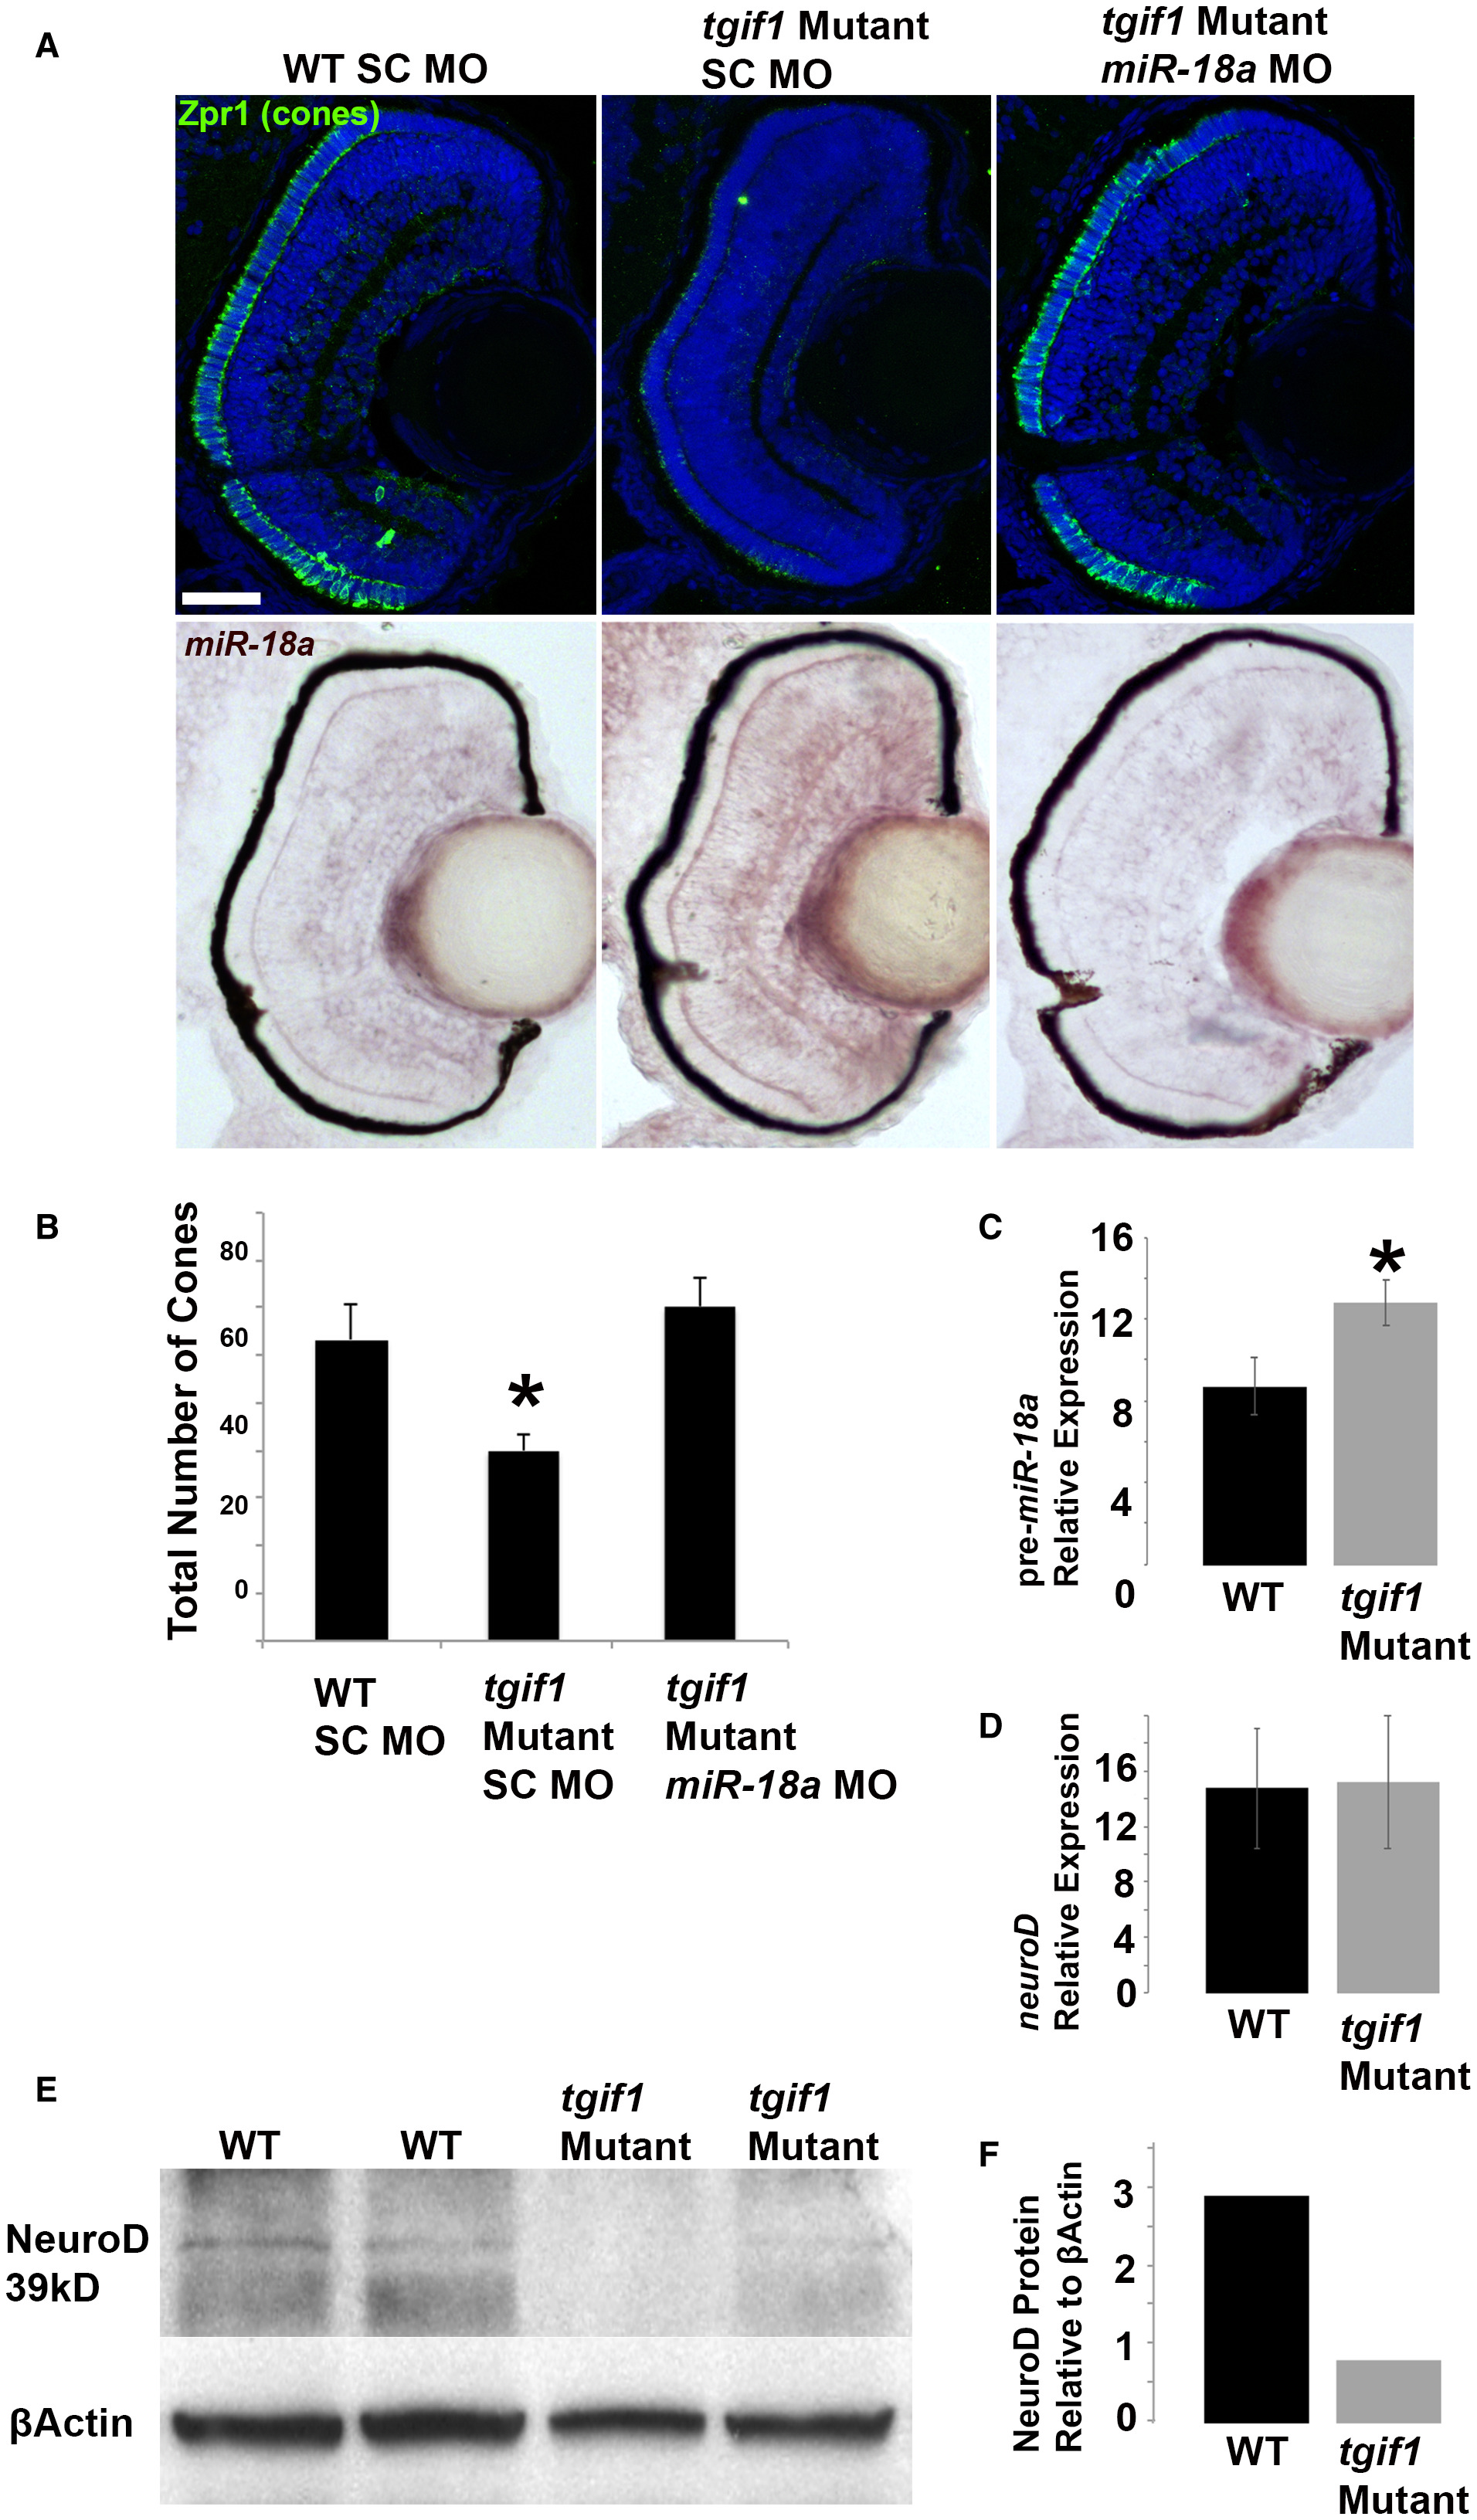
tgif1 mutant larvae have fewer photoreceptors, increased miR‐18a expression, and reduced NeuroD protein levels. (A) Immunolabeling for cone photoreceptors (Zpr‐1) at 70 hpf in the WT larvae injected with standard control morpholinos (SC MO), tgif1‐mutant larvae injected with SC MO, tgif1‐mutant larvae injected with miR‐18a morpholinos, with corresponding images showing in situ hybridization for miR‐18a in the same retinas; scale bar = 50 μm. (B) Cone photoreceptor counts in retinal cross sections (n = 3 larvae each) in fish corresponding to the images in (A). (C) Standard qPCR showing pre‐miR‐18a expression in 70 hpf WT larvae compared with tgif1 mutants (n = 40 heads); normalized to βactin and shown relative to let‐7b expression. (D) Standard qPCR comparing neuroD mRNA expression in 70 hpf larvae between WT and tgif1 mutants (n = 40 heads); normalized to βactin and shown relative to ccnb1 expression. (E) Western blot showing NeuroD protein levels in 70 hpf WT compared with tgif1‐mutant fish (n = 40 heads). (F) Quantification of the average band intensities in E. All error bars represent standard deviation and comparisons were made with Student’s ttests (asterisks indicate P < 0.05). [Colour figure can be viewed at wileyonlinelibrary.com]