
Image
|
Figure Caption
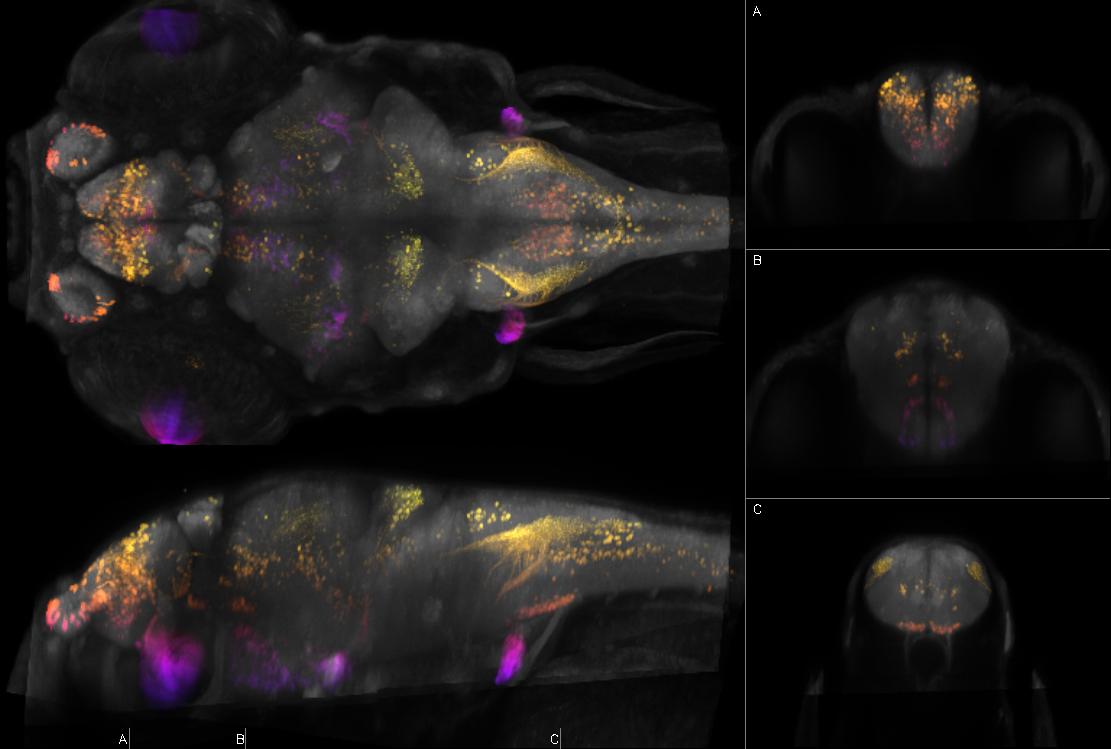
Fig.71 Left: dorsal and sagittal maximal confocal projections from Zebrafish Brain Browser. Right: coronal slices at the indicated levels. Depth coded by color. Intensity represents mean expression in larvae transgenic for y320Et and Tg(UAS:Kaede)s1999t which expresses Kaede in olfactory sensory neurons, pallium, preoptic region, posterior tuberculum, hypothalamus, aLLg, pLLg, strong cranial sensory ganglia (plus plexus in medulla), inferior olive, retina, spinal cord, swim bladder, lens
Figure Data