
FIGURE
Fig.71
- ID
- ZDB-FIG-190501-71
- Publication
- Tabor et al., 2018 - Brain-wide cellular resolution imaging of Cre transgenic zebrafish lines for functional circuit-mapping
Fig.71
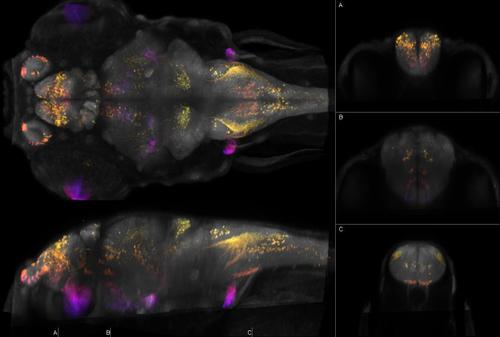
Left: dorsal and sagittal maximal confocal projections from Zebrafish Brain Browser. Right: coronal slices at the indicated levels. Depth coded by color. Intensity represents mean expression in larvae transgenic for y320Et and Tg(UAS:Kaede)s1999t which expresses Kaede in olfactory sensory neurons, pallium, preoptic region, posterior tuberculum, hypothalamus, aLLg, pLLg, strong cranial sensory ganglia (plus plexus in medulla), inferior olive, retina, spinal cord, swim bladder, lens |
Expression Data
| Gene: | |
|---|---|
| Fish: | |
| Anatomical Terms: | |
| Stage: | Day 4 |
Expression Detail
Antibody Labeling
Phenotype Data
Phenotype Detail
Acknowledgments
This image is the copyrighted work of the attributed author or publisher, and
ZFIN has permission only to display this image to its users.
Additional permissions should be obtained from the applicable author or publisher of the image.