
Fig. 3
- ID
- ZDB-IMAGE-190328-10
- Genes
- Publication
- Boyle Anderson et al., 2018 - A transcriptomics analysis of the Tbx5 paralogues in zebrafish
- All Figures
- Figures for Boyle Anderson et al., 2018
|
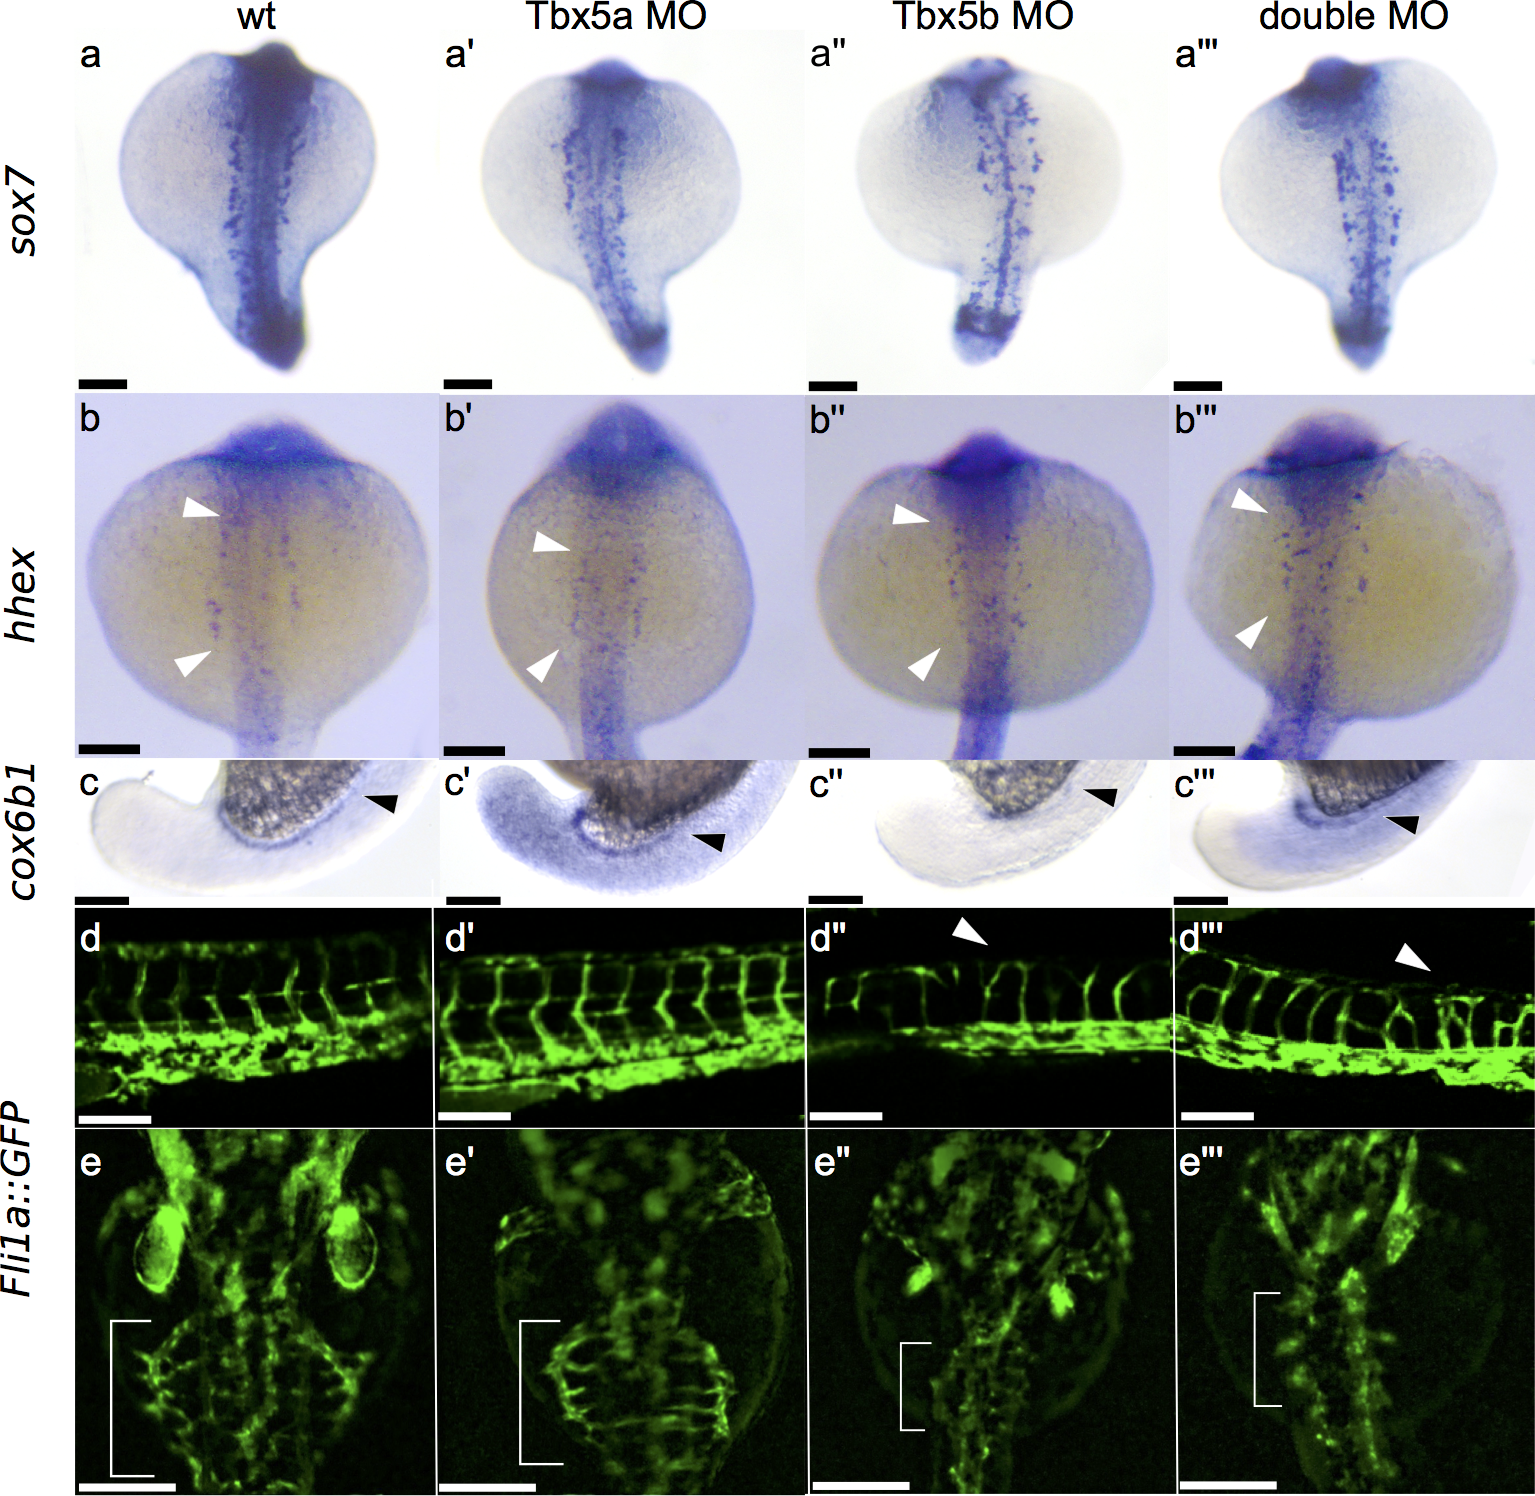
Fig. 3
Effects of Tbx5 paralogues on vasculature.
(a-a”’) Dorsal view of sox7 expression at 18 hpf showing misexpression in Tbx5a-deficient embryos (a’), Tbx5b-deficient embryos (a”) and double-deficient embryos (a”’) compared to normal wildtype expression (a). (b-b”’) Dorsal view of hhex expression at 21 hpf displaying mild misexpression in Tbx5a-deficient embryos (b’) and more severe misexpression in Tbx5b-deficient embryos (b”) and double-deficient embryos (b”’) compared to wildtype (b). (c-c”’) Lateral view of cox6b1 expression at 18 hpf in the developing pronephric duct. Arrowheads mark the anterior limit of expression. Expanded expression is present in the surrounding tissue of Tbx5a-deficient (c’) and double-deficient (c”’) embryos, while expression is decreased throughout the embryo in Tbx5b-deficient embryos (c”). (d-d”’) Lateral view of the Tg(fli1a::EGFP)y1 line displays increased branching in the intersomitic vessels of both Tbx5b-deficient (d”) and double-deficient embryos (d”’) (see arrowheads) compared to either wildtype (d) or Tbx5a-deficient embryos (d’). (e-e”’) Dorsal view of the Tg(fli1a::EGFP)y1 line. The subintestinal vessels are marked with a bracket in 3 dpf embryos. There is a decrease in size of the subintestinal vasculature in Tbx5b-deficient (e”) and double-deficient (e”’) embryos compared to either wildtype (e) or Tbx5a-deficient embryos (e’). Scale bars are 100 μm.