
Fig. 1
- ID
- ZDB-IMAGE-190201-2
- Publication
- Gamble et al., 2018 - Quantification of glioblastoma progression in zebrafish xenografts: Adhesion to laminin alpha 5 promotes glioblastoma microtumor formation and inhibits cell invasion
- All Figures
- Figures for Gamble et al., 2018
|
Fig. 1
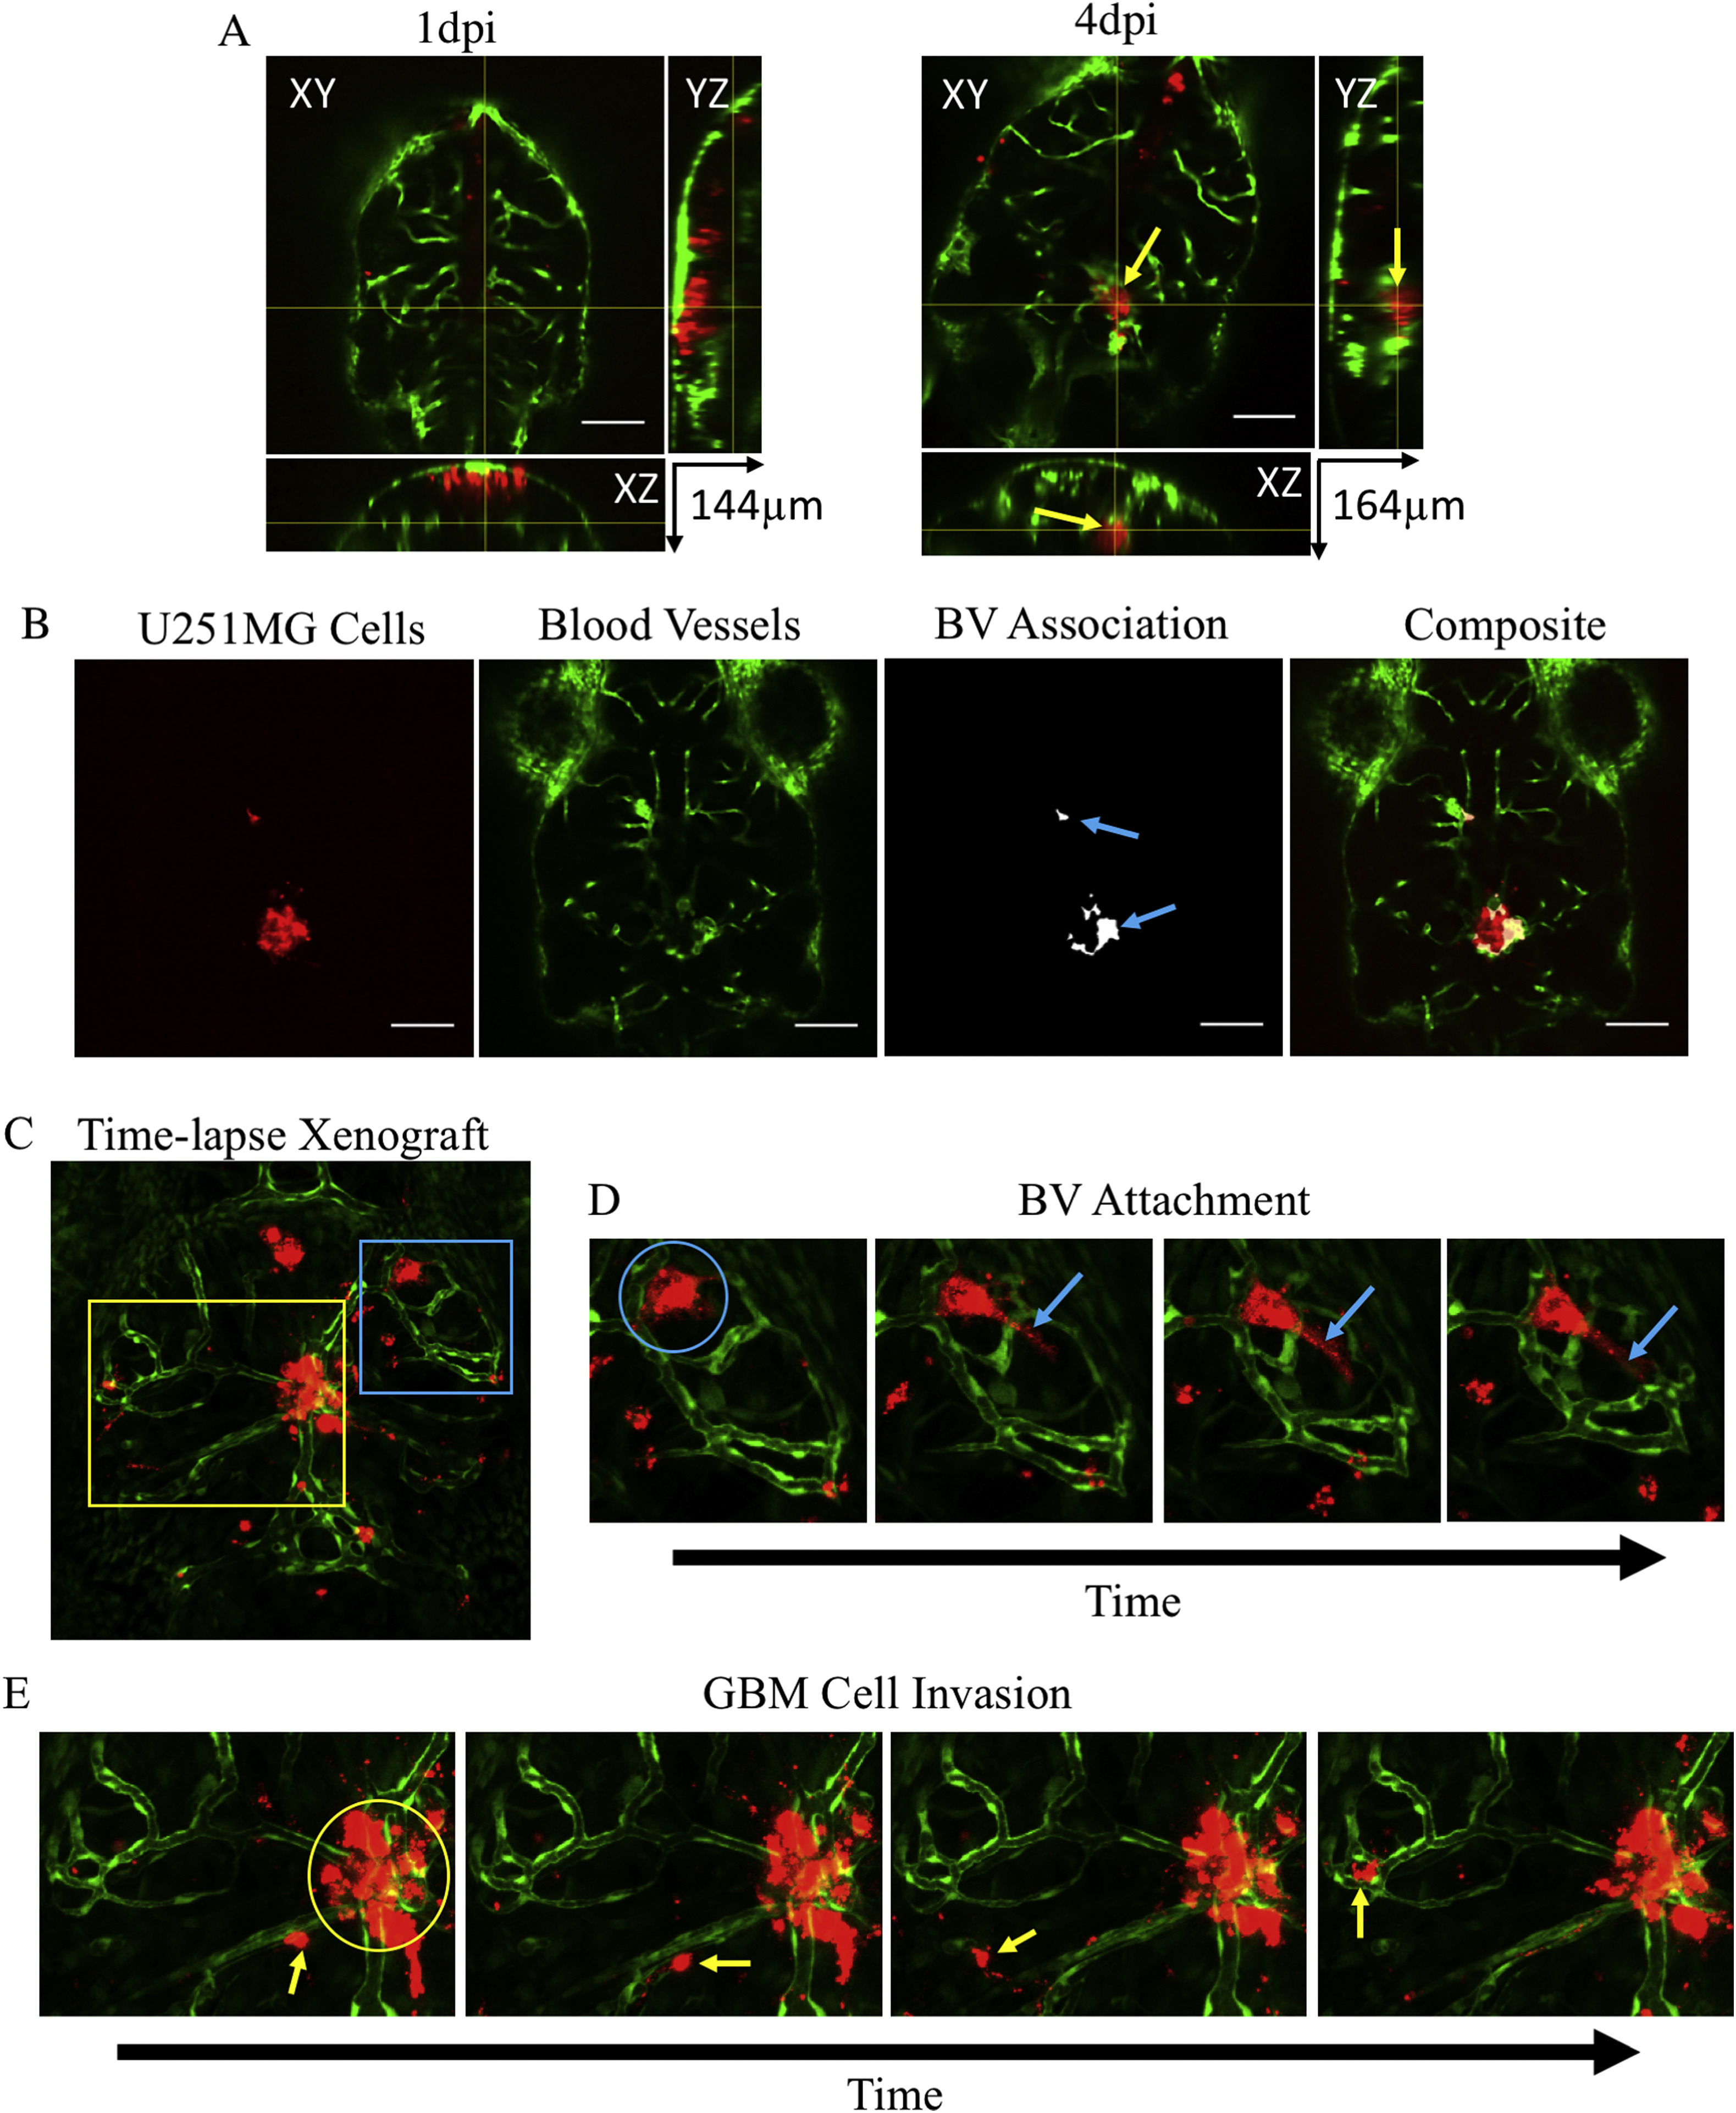
Zebrafish Brain Xenograft. A) Orthogonal views for Z-section of zebrafish brain with U251MG cells (red) and blood vessels (green) at 1 (left) and 4 (right) day post injection displaying microtumor formation (yellow arrow) occurring deep in brain surrounded with blood vessels. B) Representative panels of calculating U251MG cells associations with blood vessels (BV); 100 μm scale bar. C) Maximum projection image frame of 3D time-lapse image of zebrafish brain with blood vessels (green) and transplanted U251MG cells (red) with areas of interest indicated. Blue box: BV attachment. Yellow box: GBM cell invasion. D) Representative time-lapse images of U251MG cell attaching to blood vessels (blue circle) and constricting with pseudopodium (blue arrows). E) Representative time-lapse images of U251MG cell invading zebrafish brain (yellow arrows) and non-invasive U251MG cells (yellow circle). (For interpretation of the references to color in this figure legend, the reader is referred to the Web version of this article.)