
Fig. 1
- ID
- ZDB-IMAGE-190118-1
- Publication
- Gutzman et al., 2018 - Basal constriction during midbrain-hindbrain boundary morphogenesis is mediated by Wnt5b and focal adhesion kinase
- All Figures
- Figures for Gutzman et al., 2018
|
Fig. 1
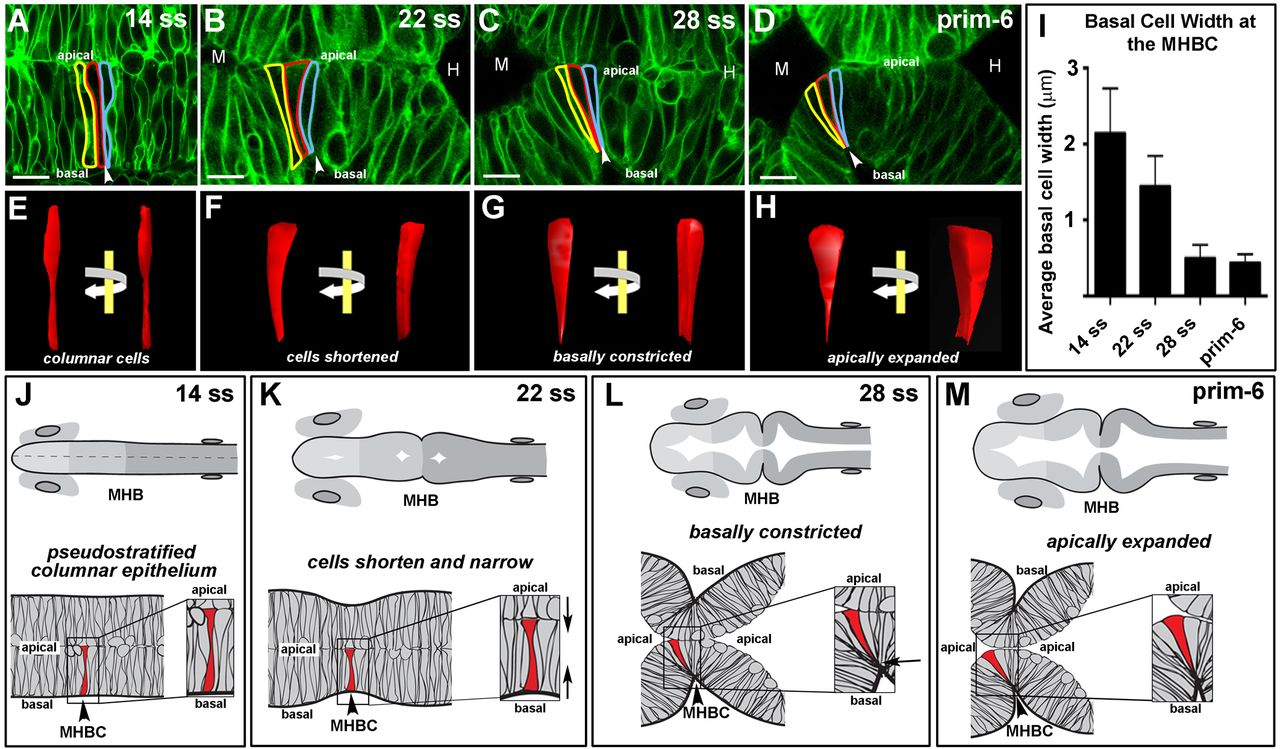
Basal constriction at the zebrafish MHBC occurs prior to apical expansion and results in wedge-shaped cells. (A–D) Live scanning confocal imaging of wild-type embryos injected with mGFP mRNA and imaged at 14 ss, 22 ss, 28 ss, and prim-6. Cells at the MHBC are outlined in yellow, red, and blue. (E–H) 3D reconstruction of red outlined cell using 3D Doctor (Able Software). Each reconstruction is shown from two viewpoints: face-on as in the confocal image, and with a 45° rotation of the same image. (I) Histogram comparing the basal width of cells at each time point. (J–M) Schematics of wild-type MHBC formation. Anterior is to the left in all images. Arrowheads indicate the MHBC. M, midbrain; H, hindbrain. A–D, n>8 embryos per stage; I, n=3 embryos with 6 cells measured per embryo for each time point. Error bars reflect ±s.d. Scale bars: 9 µm.