
Fig. 5
- ID
- ZDB-IMAGE-181207-61
- Antibodies
- Publication
- Teng et al., 2018 - Altered bone growth dynamics prefigure craniosynostosis in a zebrafish model of Saethre-Chotzen syndrome
- All Figures
- Figures for Teng et al., 2018
|
Fig. 5
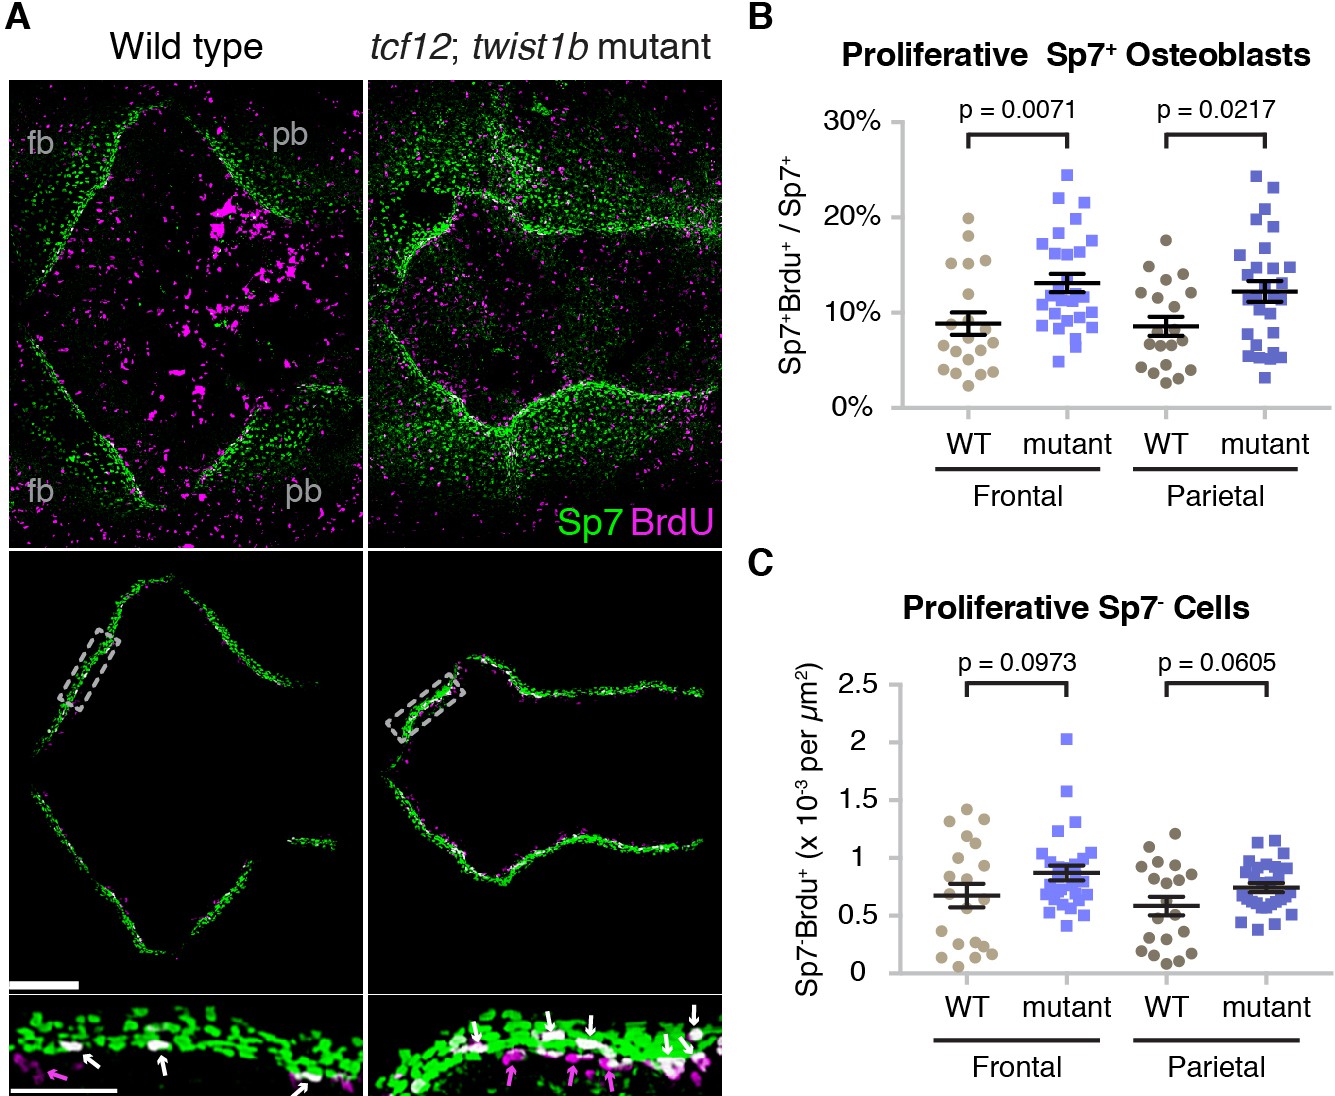
Altered proliferation and osteoblast production at mutant zebrafish bone fronts.
(A) Dissected skullcaps were stained for BrdU (magenta) and Sp7 protein (green) at 9 mm. Top panels show maximum intensity projections of whole skull volumes, and middle panels are the same volumes but processed to extract the bone fronts (note that much of the BrdU staining in the center of the top images is in the skin). Bottom panels show enlarged regions of the osteogenic fronts (dotted rectangles). White arrows show proliferative osteoblasts (BrdU+/Sp7+) and magenta arrows show adjacent proliferative Sp7- cells. fb, frontal bone; pb, parietal bone. Scale bars, 300 µm for whole skull view, 100 µm for enlarged view. (B, C) Based on the extracted osteogenic fronts (middle panels in A), we quantified the percentage of Sp7+ osteoblasts that were BrdU+ (B) and the number of adjacent BrdU+/Sp7- cells per area (C). Wild-type controls, n = 20; tcf12; twist1b mutants, n = 28. p values were determined by a Student’s t-test; error bars represent standard error of the mean.