
|
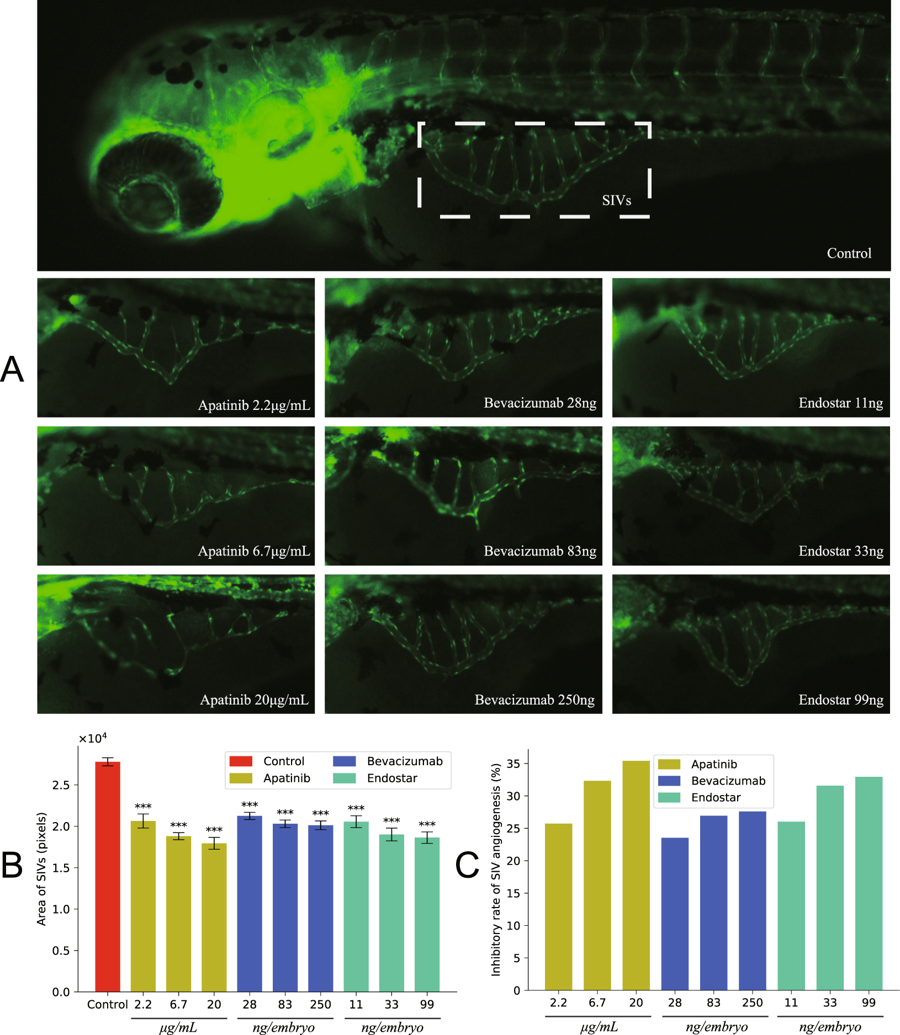
Fig. 1
Anti-angiogenic effects after treatment with angiogenesis inhibitors. (A) Lateral view of subintestinal vessels (SIVs) in fluorescent transgenic zebrafish embryos at 3dpf that were treated with anti-angiogenic drugs at different concentrations for 24 hours. (B) Total area of SIVs (in pixel). (C) The inhibitory rate of SIVs angiogenesis is calculated as difference between total area of SIVs in treated and control groups expressed as percentage of total area of SIVs in control zebrafish embryos. The error bars represent ± SEM. P values were determined by one-way ANOVA followed by Dunnett’s test for multiple comparisons to control. ***p < 0.001 indicate statistically significant difference. SEM, standard error of the mean.