
Image
|
Figure Caption
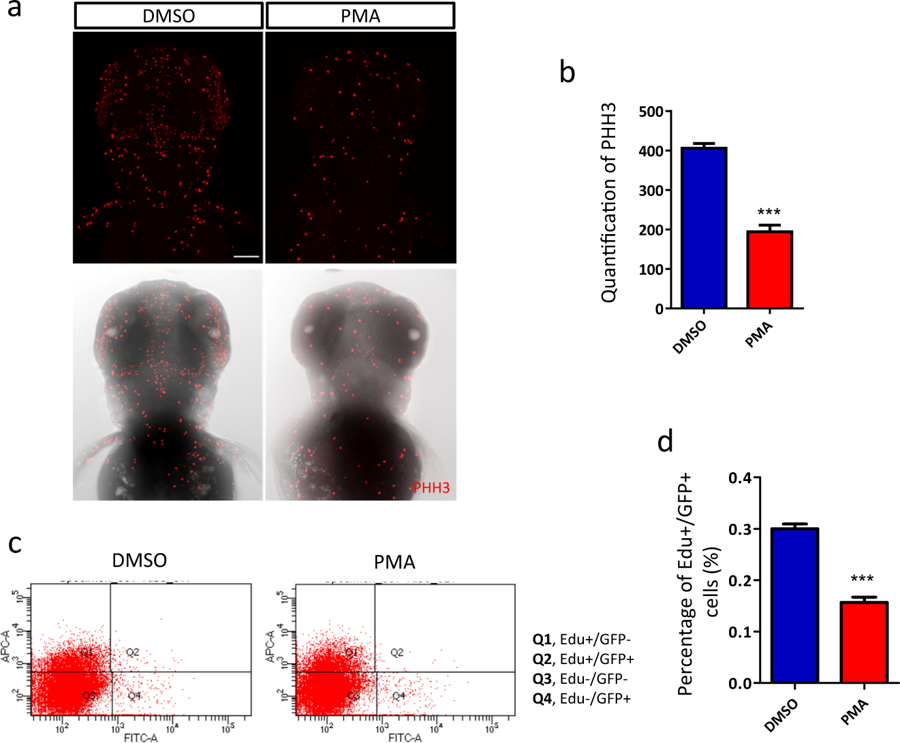
Fig. 2
Aberrant PKC activation impaired neurogenesis.
a, b Reduced mitotic cells in zebrafish head (3 dpf). a Fluorescence of pHH3-positive dots (the upper row) merged with brightfield images of zebrafish head (the lower row) (n = 26 per group, ***p < 0.001, t-test). Scale bar, 100 μm. c Flow cytometry analysis of the different populations of cells. d Newborn neurons (Q2) are significantly reduced in PMA-exposed fish (n = 9 per group, p < 0.001, t-test)
Figure Data
Acknowledgments
This image is the copyrighted work of the attributed author or publisher, and
ZFIN has permission only to display this image to its users.
Additional permissions should be obtained from the applicable author or publisher of the image.
Full text @ Transl Psychiatry