
Fig. 3
- ID
- ZDB-IMAGE-181130-21
- Antibodies
- Publication
- Elbialy et al., 2018 - A Zebrafish Acromegaly Model Elevates DNA Damage and Impairs DNA Repair Pathways
- All Figures
- Figures for Elbialy et al., 2018
|
Fig. 3
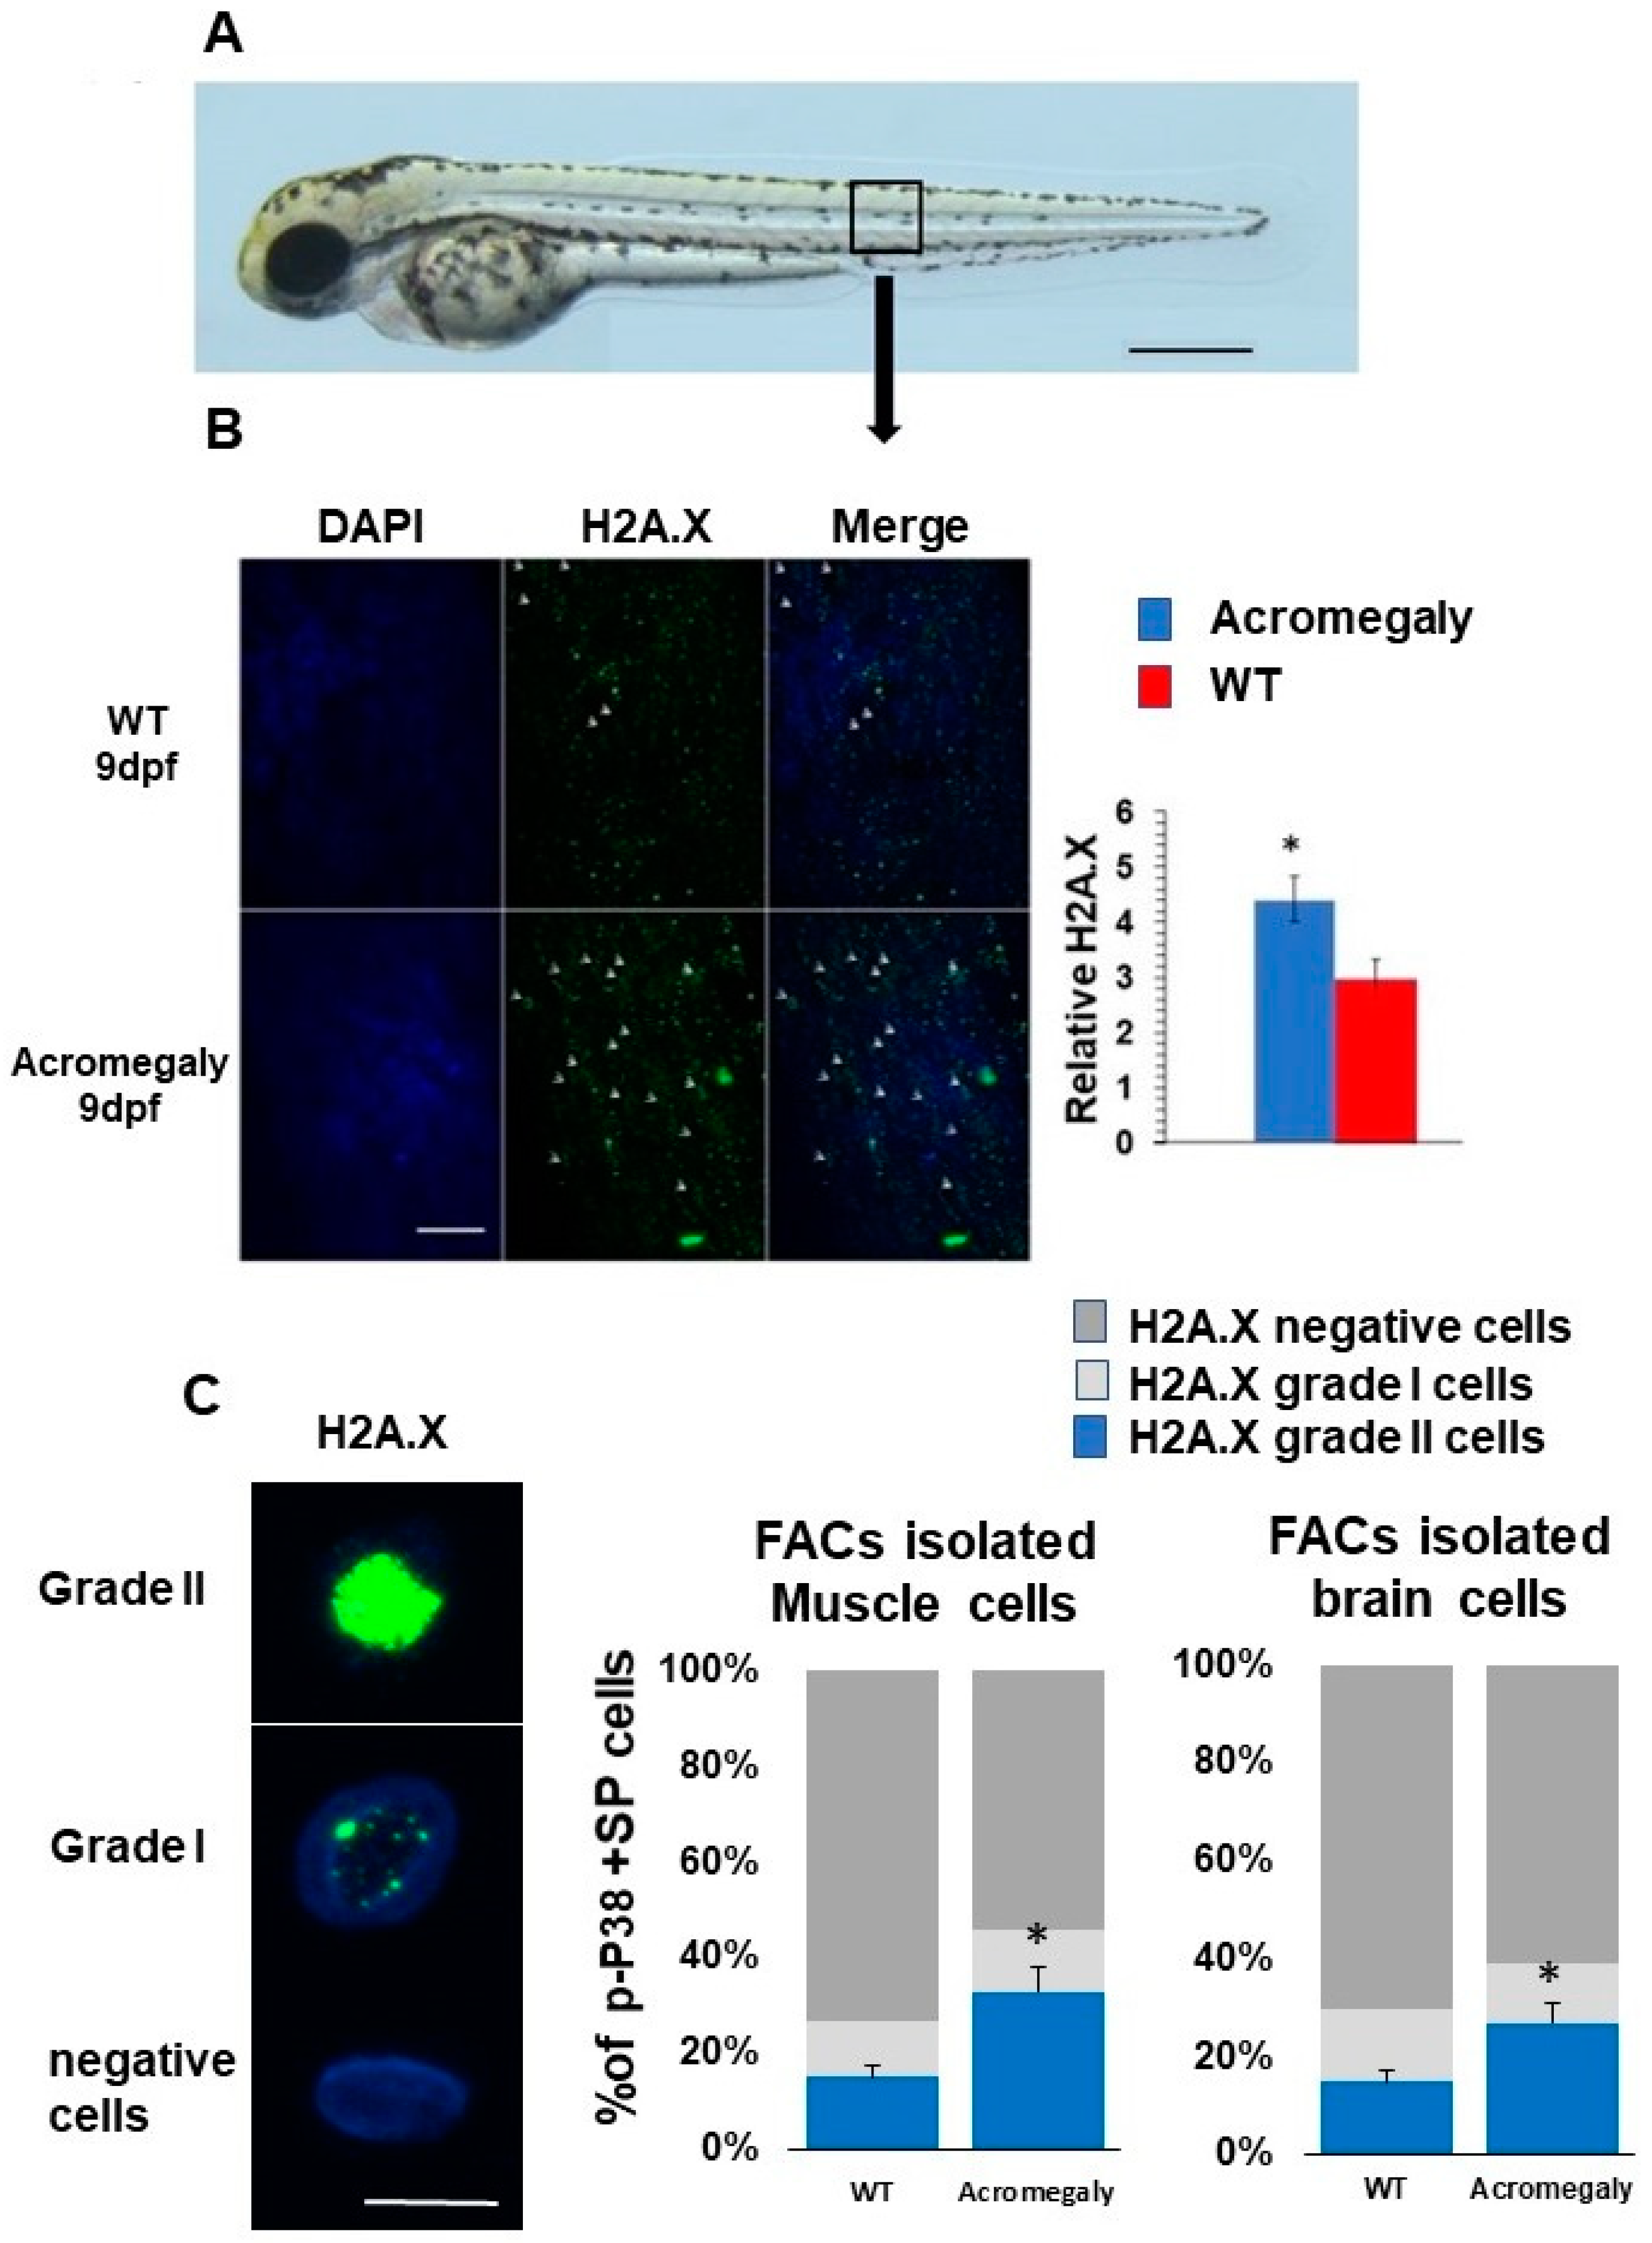
Increased DNA damage in Acromegaly zebrafish larvae and adult. (A) A zebrafish larva showing the area for taking the image for H2A.X quantification (black box). Bar = 500 µm. (B) Representative H2A.X whole-mount immunostaining and quantification in acromegaly and WT zebrafish (9 dpf) showing a significant increase in the number of H2A.X stained cell nuclei in the acromegaly zebrafish model. Arrows in panel B show H2A.X stained cell nuclei. Bar = 40 µM. Quantification was performed using Fiji software. (C) Representative H2A.X grade I, grade II, and negatively stained cells. Bar = 5 µM (left). Quantification of H2A.X positive and negative stained live isolated cells from the muscle and brain of acromegaly and WT (one-year-old) fish (left). Data are expressed as the mean ± SE (n = 3). Statistical difference (t-test, P < 0.05) is denoted by an asterisk.