
Image
|
Figure Caption
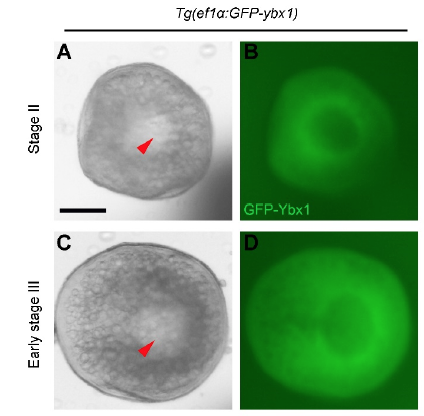
Fig. S6
GFP-Ybx1 expression in oocytes. Expression of GFP-Ybx1 fusion protein in Tg(ef1α:GFP-ybx1) oocytes at stage II (A,B) and early stage III (C,D). (A,B) Bright-field images. (C,D) Fluorescent images. Red arrowheads indicate oocyte nuclei. Scale bar: 100 μm.
Acknowledgments
This image is the copyrighted work of the attributed author or publisher, and
ZFIN has permission only to display this image to its users.
Additional permissions should be obtained from the applicable author or publisher of the image.
Full text @ Development