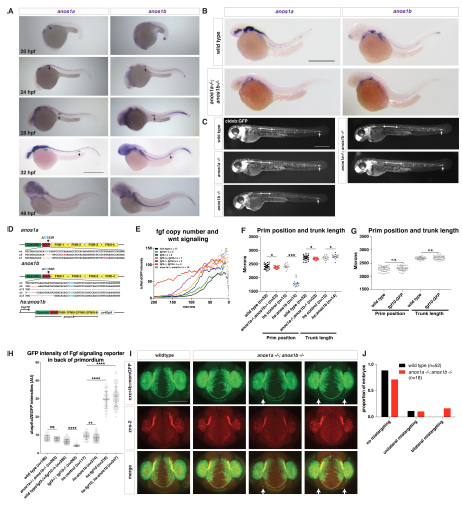
Fig. S3
Characterization of the anos1a and anos1b mutant embryos, Related to Figure 3.
(A) Expression of anos1a and anos1b mRNA (purple) at indicated developmental stages. Arrow indicates the primordium. Scale bar = 500 μm.
(B) Expression of anos1a (left) or anos1b (right) mRNA in wild-type (top) and anos1a-/-; anos1b-/- (bottom) embryos (purple). Scale bar = 500 μm.
(C) Neuromast deposition and primordium migration in anos1a and anos1b single mutant and anos1a; anos1b double mutant embryos. Arrow denotes position of primordium and double-headed arrow indicates spacing between neuromast 1 and 2. The increased spacing between neuromast 1 and 2 in anos1a; anos1b double mutants is not fully penetrant. Scale bar = 500 μm.
(D) Schematic of anos1a and anos1b mutant alleles and hsp70:anos1b over-expression transgene. Top and middle, red dashes indicate missing nucleotides in the mutant alleles and red nucleotides denote premature STOP codons. Red asterisk (middle) marks the position of exon/intron boundary. Light blue cysteine C163 (top) and C155 (middle) are homologous to C172, which leads to Kallmann syndrome in humans when mutated to arginine. The codon for these cysteines is indicated in light blue. The premature STOP in the anos1b D5 allele is 123 nt downstream of the deletion and outside of the region shown. All anos1a-/-; anos1b-/- embryos are anos1a D5/D7; anos1b D5/D79. Bottom, anos1b domains are encoded downstream of the hsp70 promoter as a continuous stretch of cDNA followed by an SV40pA polyadenylation signal.
(E) Comparison of Wnt reporter (tcf/lef-miniP:dGFP) intensity in the primordia of embryos with different mutant copy numbers of fgf3 and fgf10a and primordia of anos1a- /-; anos1b-/- mutant embryos. X-axis represents distance from the front of the primordium. Data points indicate the mean. Error bars are not shown for clarity. n = number of individual embryos measured.
(F) Quantification of the position of the primordium and length of the trunk in embryos of the indicated genotype at 50 hpf measured from the posterior margin of the otic vesicle. Black lines indicate the average. Data points are individual embryos. * = p < 0.05, *** = p < 0.001.
(G) Quantification of the position of the primordium and length of the trunk in embryos of the indicated genotype at 50 hpf measured from the posterior margin of the otic vesicle. Black lines indicate the average. Data points are individual embryos. n.s. = p > 0.05.
(H) Quantification of the GFP intensities of the Fgf signaling reporter dusp6:d2EGFP in the back only of the primordia of the indicated genotypes. Black lines indicate the average. Gray data points are individual pixel measurements in the back of the primordia of the embryos averaged in Fig. 3D and 7F. **** n.s.= p > 0.05, ** = p < 0.01., and **** = p < 0.0001. ANOVA p<0.0001.
(I) Olfactory axon targeting in wild-type and anos1a-/-; anos1b-/- embryos at 28 hpf. Olfactory axons are labeled with the cxcr4b:cxcr4b-Kate2-ires-GFP-CAAX transgene and stained with the zns-2 antibody that labels olfactory pioneer neuron cell membranes (Trevarrow et al., 1990). Arrows indicate mistargeted axons.
(J) Quantification of olfactory axon targeting defects in wild-type and anos1a-/-; anos1b- /- embryos. Defects were grouped as indicated and represented as fraction of the total number of embryos.
Reprinted from Developmental Cell, 46(6), Wang, J., Yin, Y., Lau, S., Sankaran, J., Rothenberg, E., Wohland, T., Meier-Schellersheim, M., Knaut, H., Anosmin1 Shuttles Fgf to Facilitate Its Diffusion, Increase Its Local Concentration, and Induce Sensory Organs, 751-766.e12, Copyright (2018) with permission from Elsevier. Full text @ Dev. Cell

