
|
Fig. S4
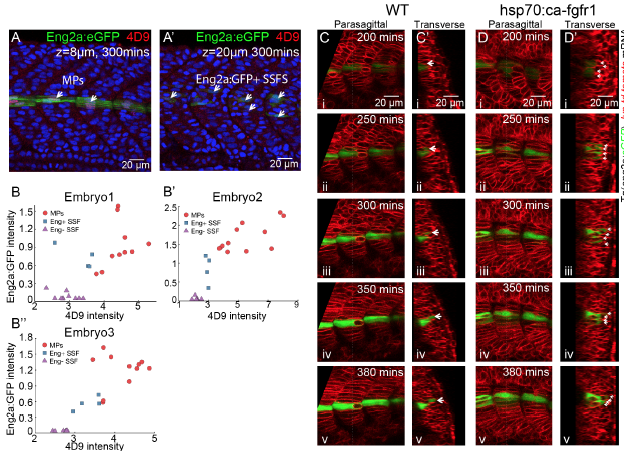
Quantification of Eng expression throughout myogenesis, related to Figure 6
(A and A’) Co-staining of anti-engrailed antibody 4D9 and eng2a:GFP. White short arrows label MPs and eng2a:GFP+ SSFs in (A) and (A’) at different z-plane respectively. Images are taken at around 5 hours later after segmentation of corresponding muscle segments (segments 18-21). (B-B’’) Antiengrailed antibody intensity versus expression level of eng2a:GFP from three embryos among MPs (red circles), eng2a:GFP+ SSFs (blue rectangles) and eng2a:GFP- SSFs(purple triangles). (C and D) Time lapse of MPs differentiation with migrating eng2a:GFP+ SSFs in WT embryos (C) and embryos under heat shock of hsp70l:ca-fgfr1 (D) from 200mins after segmentation to 380mins after segmentation (i-v). (C’ and D’) Transverse view of (C and D) with dorsal to the top and medial to the left. White short arrows label eng2a:GFP+ SSFs. Images are taken at muscle segments 18-21.
Reprinted from Developmental Cell, 46, Yin, J., Lee, R., Ono, Y., Ingham, P.W., Saunders, T.E., Spatiotemporal Coordination of FGF and Shh Signaling Underlies the Specification of Myoblasts in the Zebrafish Embryo, 735-750.e4, Copyright (2018) with permission from Elsevier. Full text @ Dev. Cell