
|
Fig. 3
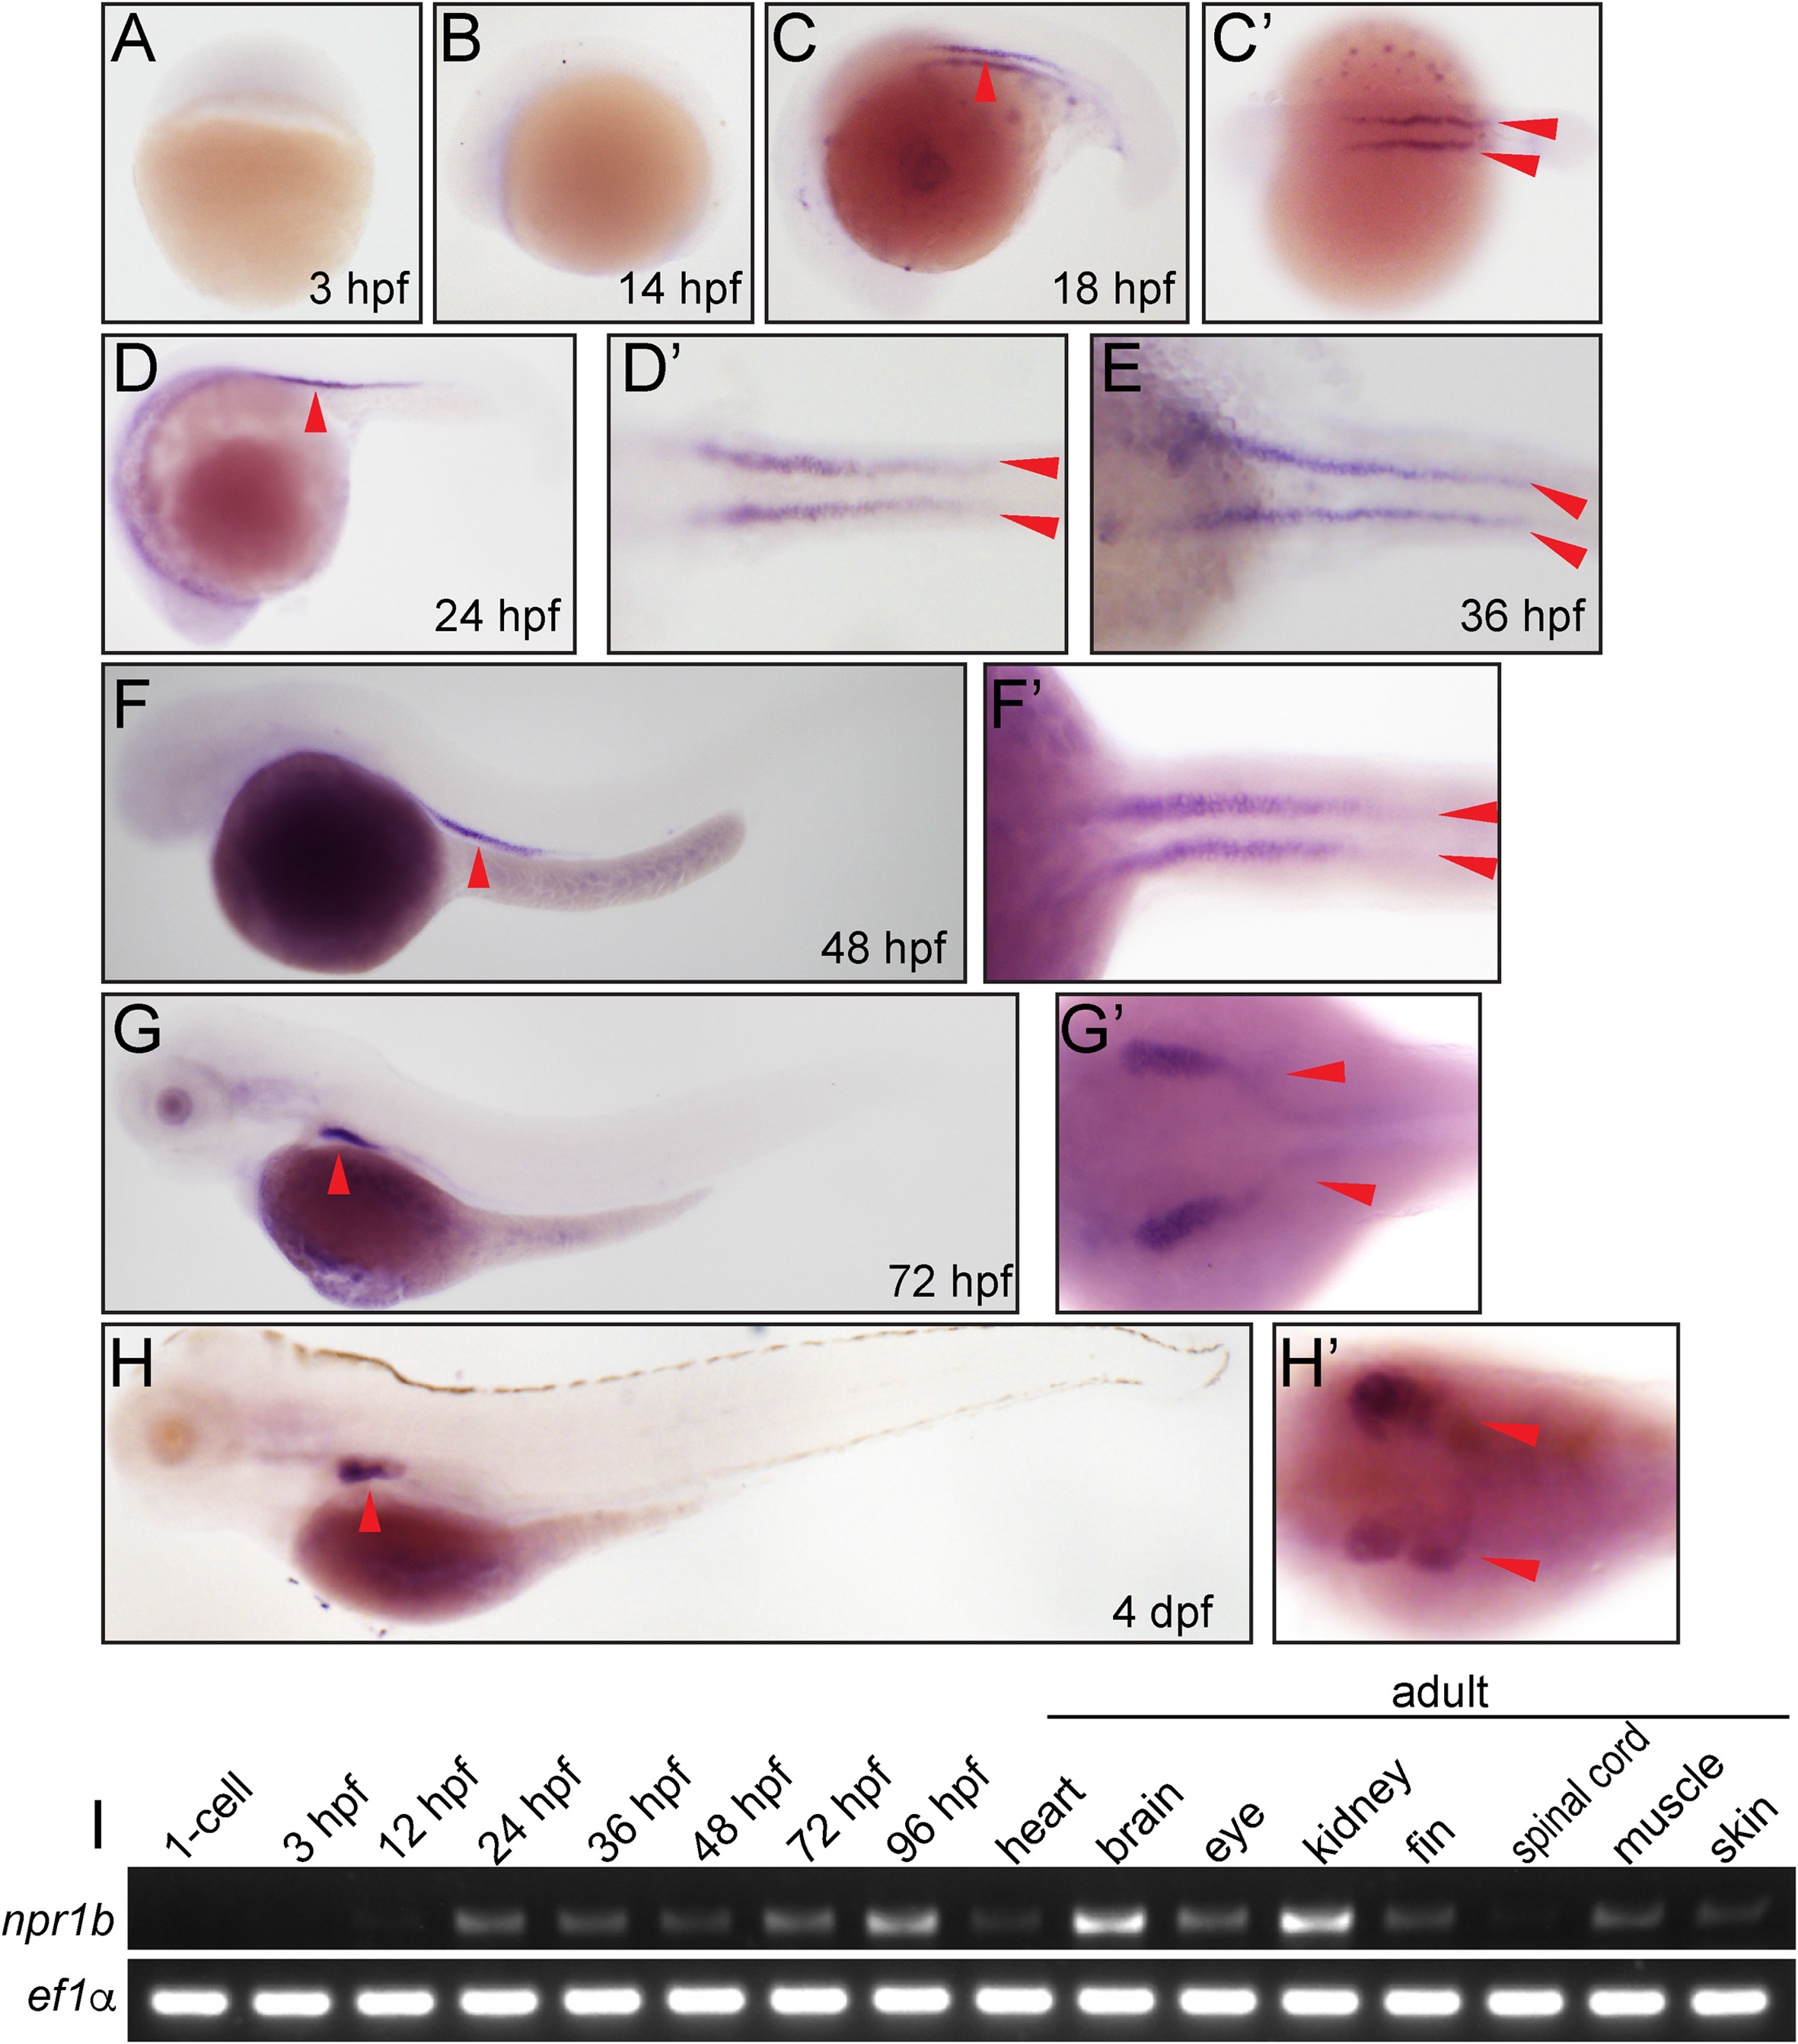
Expression analysis of zebrafish npr1b. (A) 3 hpf, lateral view, no staining. (B) 14 hpf, lateral view, no staining. (C) 18 hpf, lateral view, red arrowhead indicates anterior pronephric duct. (C′) 18hpf, dorsal view, arrowheads indicate anterior pronephric duct. (D) 24 hpf, lateral view, arrowhead indicates anterior pronephric duct. (D′) 24 hpf, dorsal view, arrowheads indicate anterior pronephric duct. (E) 36 hpf, dorsal view, arrowheads indicate anterior pronephric duct. (F) 48 hpf, lateral view, arrowhead indicates anterior pronephric duct. (F′) 48 hpf, dorsal view, arrowheads indicate anterior pronephric duct. (G) 72 hpf, lateral view, arrowhead indicates anterior pronephric duct. (G′) 72 hpf, dorsal view, arrowheads indicate anterior pronephric duct. (H) 4 dpf, lateral view, arrowhead indicates anterior pronephric duct. (H′) 4 dpf, dorsal view, arrowheads indicate anterior pronephric duct. (I) Reverse transcriptase-PCR analysis of zebrafish npr1b.
Reprinted from Gene expression patterns : GEP, 29, Gong, J., Chai, L., Xu, G., Ni, Y., Liu, D., The expression of natriuretic peptide receptors in developing zebrafish embryos, 65-71, Copyright (2018) with permission from Elsevier. Full text @ Gene Expr. Patterns