
Fig. 3
- ID
- ZDB-IMAGE-180917-3
- Genes
- Publication
- Mattes et al., 2018 - Wnt/PCP controls spreading of Wnt/β-catenin signals by cytonemes in vertebrates
- All Figures
- Figures for Mattes et al., 2018
|
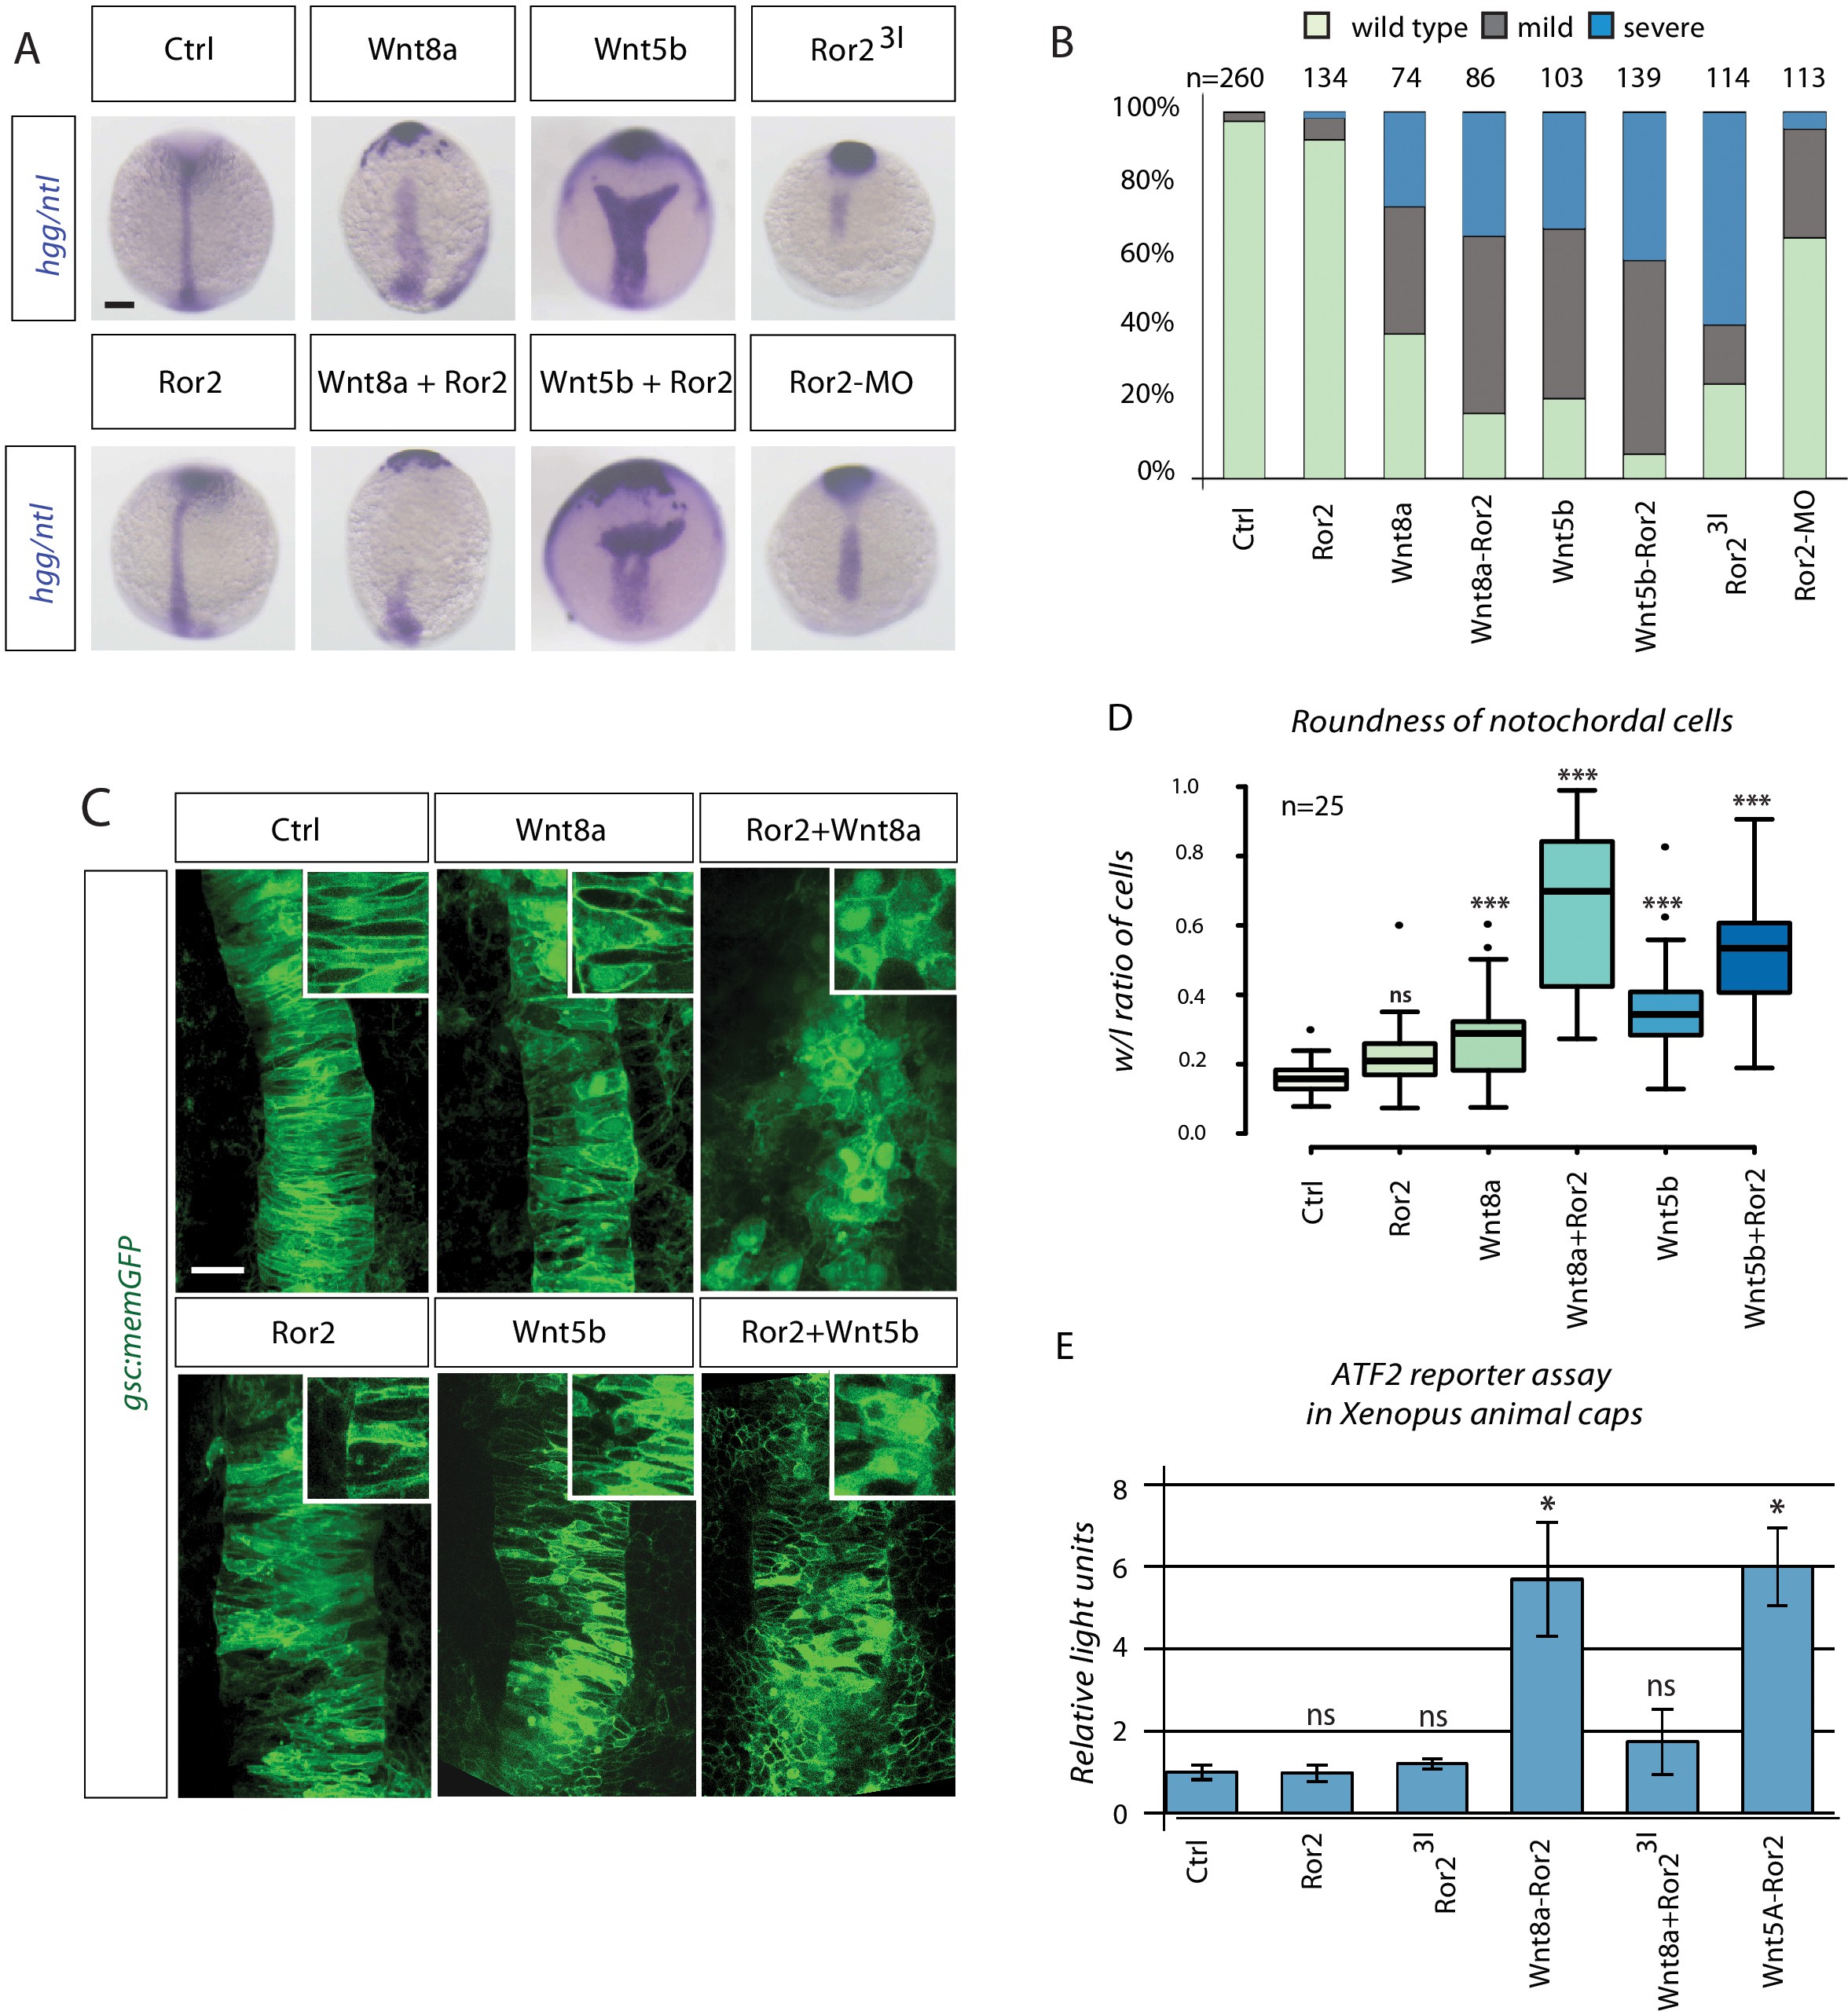
Fig. 3
Synergistic Wnt PCP activation by Wnt8a and Ror2 in zebrafish and Xenopus embryos.
(A) Embryos at 11 hpf were fixed and subjected to in situ hybridization against hgg/ntl. Scale bar represents 200 µm. (B) Embryos were sorted into groups according to their phenotypes (see Figure 3—figure supplement 1 for details). (C) gsc:memGFP embryos were microinjected with the indicated constructs, fixed at 11 hpf and a defined z-stack was imaged by confocal microscopy. The confocal stack shows the notochord marked by gsc:memGFP from a dorsal view with the animal site to the top. Magnified insets highlight the shape of the notochord cells. Scale bar represents 20 µm. (D) Analysis of cell roundness. The boxplot shows the width/length ratio of 25 notochordal cells. Circularity ranges from 0 (infinitely elongated polygon) to 1 (perfect circle). ANOVA confirmed that cell roundness is significantly different in the analyzed groups with p=2.91*10−24, confidence interval 95%, F value=37, and df=149. (E) ATF luciferase reporter assay of pooled Xenopus gastrulae injected with the indicated constructs and the ATF2 firefly and Renilla luciferase reporter. Data shown are the mean with SD of three independent experiments. ***=P<0.001, **=P<0.01, *=P<0.05, ns, not significant.