
Fig. 4
- ID
- ZDB-IMAGE-180911-36
- Genes
- Publication
- Muralidharan et al., 2018 - Retinal Wnt signaling defect in a zebrafish fetal alcohol spectrum disorder model
- All Figures
- Figures for Muralidharan et al., 2018
|
Fig. 4
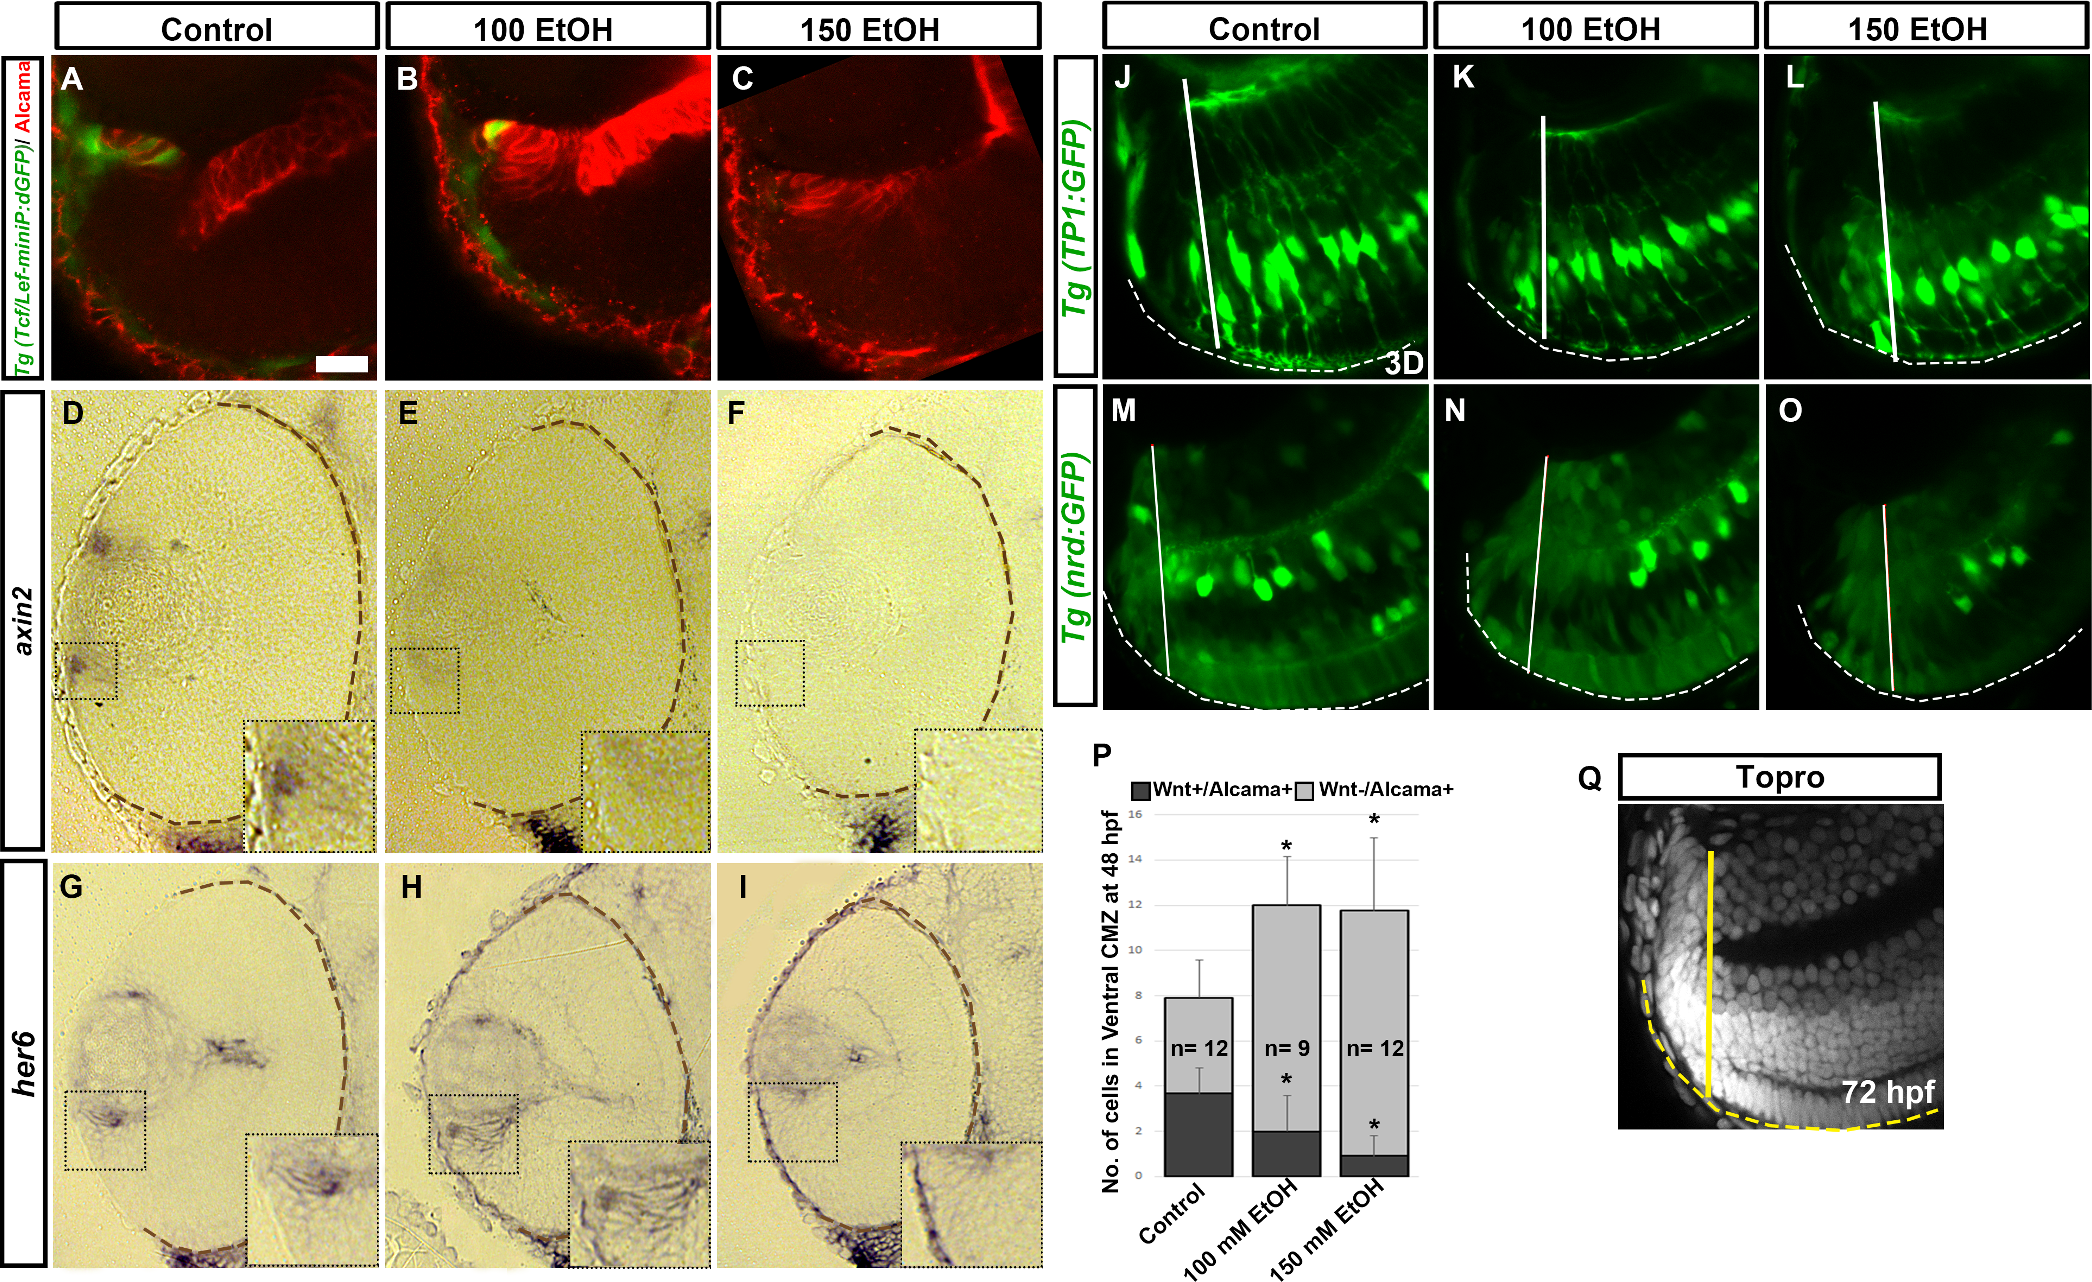
Effect of ethanol exposure on Wnt signaling, and Notch and proneural gene expression.
(A-C) Tg(Tcf/Lef-miniP:dGFP) fish showed Wnt-active cells (green) in the peripheral CMZ labeled with Alcama (red). (D-F) axin2 ISH showed decreased axin2 expression in peripheral CMZ after ethanol exposure. (G-I) her6 ISH sections showed an expansion of her6 expression in the CMZ after ethanol treatment at 48hpf. Boxed regions in ISH sections highlighting the peripheral retina were magnified in the insets for each image. (J-L) 3D rendition of Tg(TP1:GFP) fish showed expanded Notch-active cells in the CMZ. (M-O) Central CMZ region of Tg(nrd:GFP) fish showed increased neurod-positive cells after ethanol treatment at 72 hpf. (P) Quantification of Wnt+/Alcama+ and Wnt-/Alcama + cells in the peripheral CMZ. Solid lines demarcate the CMZ from the neural retina based on retinal lamination using TO-PRO-3 staining as indicated (Q, yellow). Dashed lines (white, brown and yellow) indicate RPE of the retina. Numbers of cells were counted in a single optic-nerve containing confocal optical section in the ventral CMZ. Images show rostral at top, lateral at left. Error bars indicate standard deviation. ‘*’ indicates statistical significance in comparison to control embryos (p<0.05). Scale bar = 10 μm for panels A-C and J-O.