
|
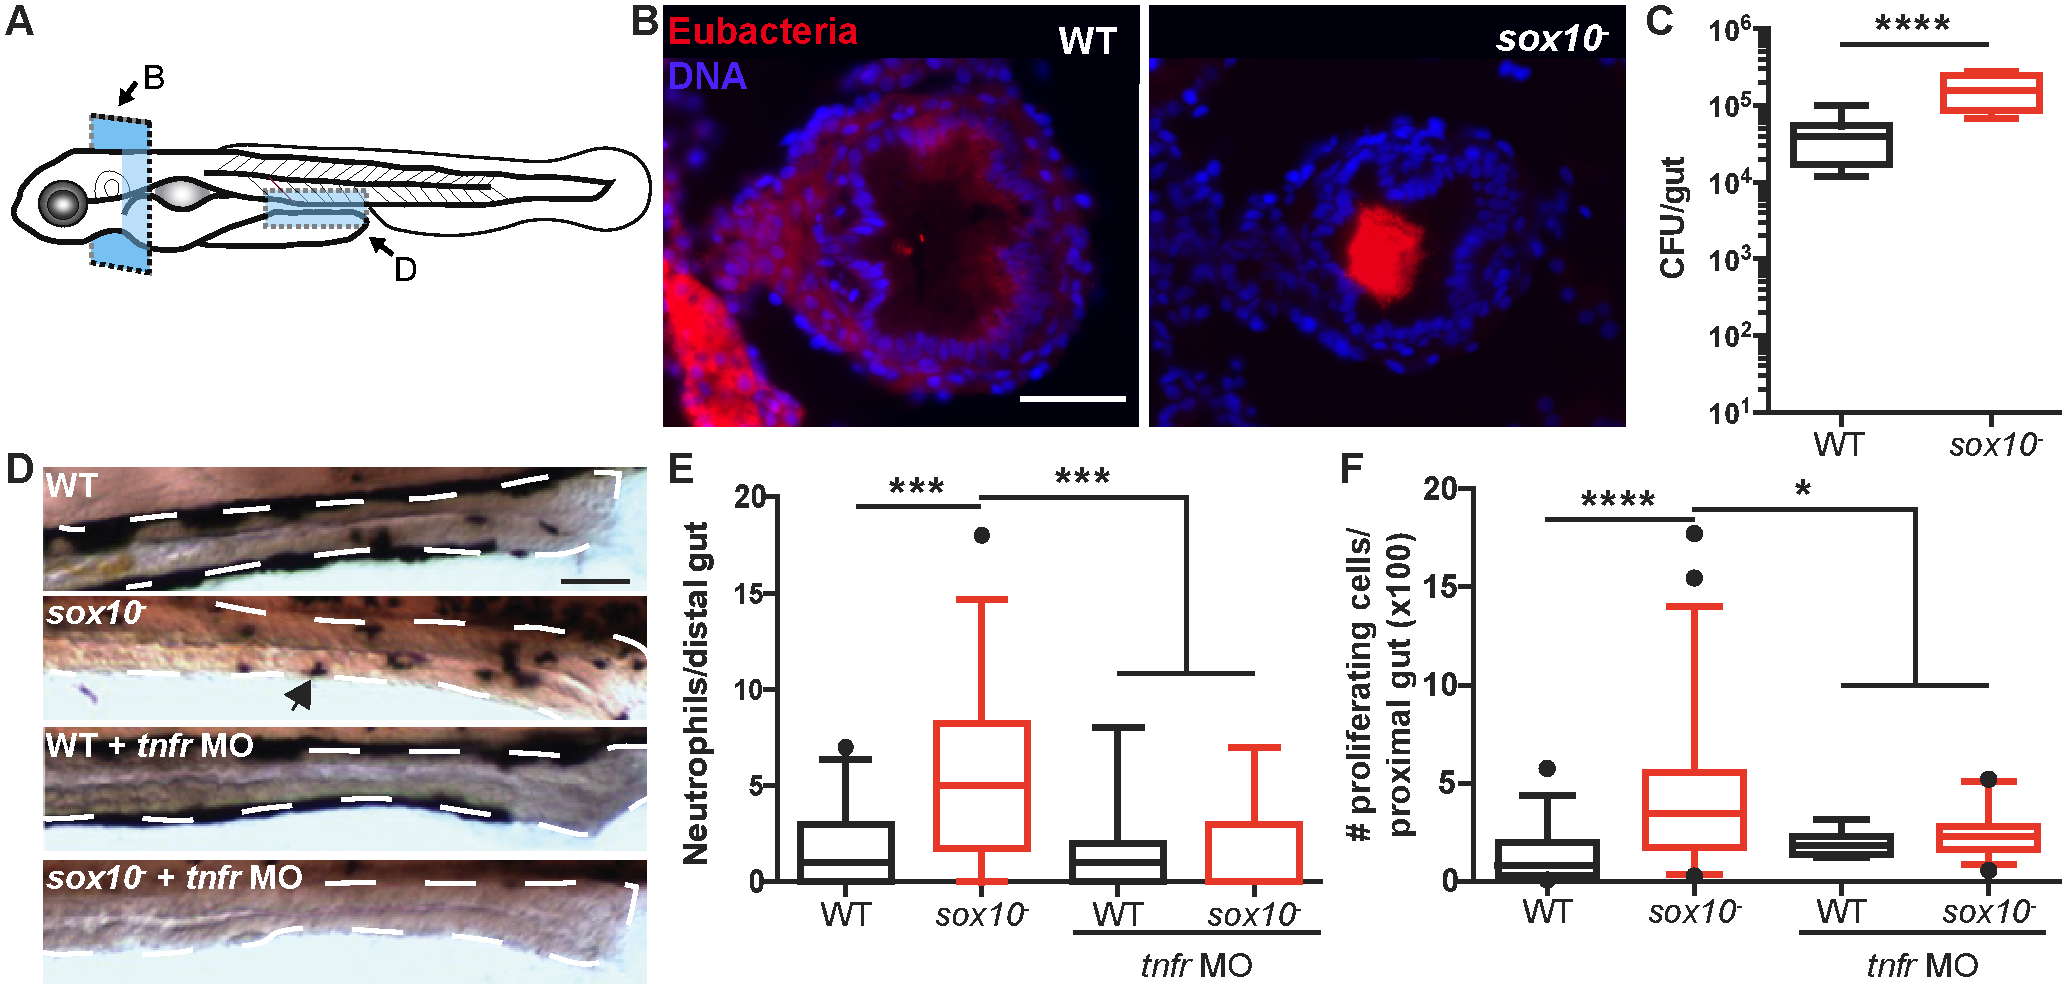
Fig. 1
sox10 mutants experience bacterial overgrowth and physiological indications of dysbiosis.
(A) Schematic representation of the location and orientation of images in B and D. (B) Representative images of the panbacterial population by FISH on the esophageal-intestinal junction of WT (left) and sox10- (right) fish. Blue, DNA; red, eubacteria. (C) Quantification of bacterial colonization level in sox10 mutants and WT siblings. (D) Representative images of WT, sox10 mutant, and tumor necrosis factor receptor (tnfr) morpholino (MO) injected larvae of both genotypes. Arrowhead indicates neutrophil. (E) Quantification of intestinal neutrophil number per 140 μm of distal intestine. (F) Total numbers of proliferating cells over 30 serial sections beginning at the esophageal-intestinal junction and proceeding into the bulb in 6-d-post-fertilization (dpf) fish. Box plots represent the median and interquartile range; whiskers represent the 5–95 percentile. n > 15 per group, *p < 0.05, ***p < 0.001, ****p < 0.0001, ANOVA with Tukey’s range test. Also see S1 Fig. Scale bars = 50 μm.