
|
Fig. 3
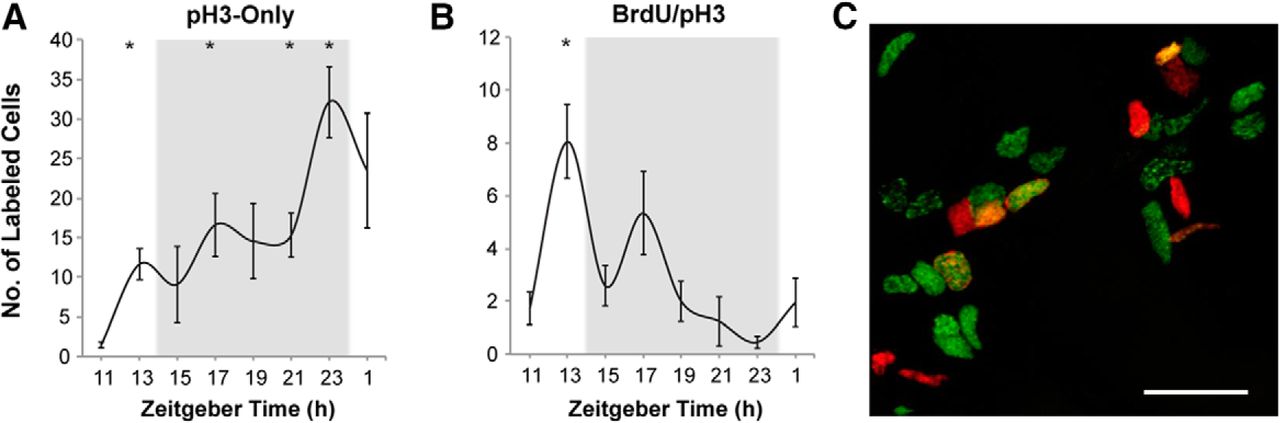
Nighttime transition of dividing cells through G2/M phases of the cell cycle in the cerebellum of adult zebrafish. A–C, Number of cells expressing pH3, a late G2 and early M phase marker, and BrdU, a marker for S phase. A, Cells positive for pH3-only increase throughout the night, B, Cells with colocalized BrdU/pH3 label decline throughout the night. n = 3–6 fish per time point; mean ± SEM; *p < 0.05 relative to the trough in labeled cells (pH3-only, ZT11; BrdU/pH3, ZT23). The gray background indicates night, 14:10 LD cycle. Fish were collected at specified ZT, after a 2 h in vivo exposure to BrdU. ZT14 is lights-off time. C, Representative confocal image: cells labeled for pH3-only (red), BrdU-only (green), and BrdU/pH3 merge (yellow). Scale bar, 20 μm.