
Fig. 1
- ID
- ZDB-IMAGE-180809-13
- Genes
- Publication
- Fleming et al., 2018 - Rapamycin attenuates pathological hypertrophy caused by an absence of trabecular formation
- All Figures
- Figures for Fleming et al., 2018
|
Fig. 1
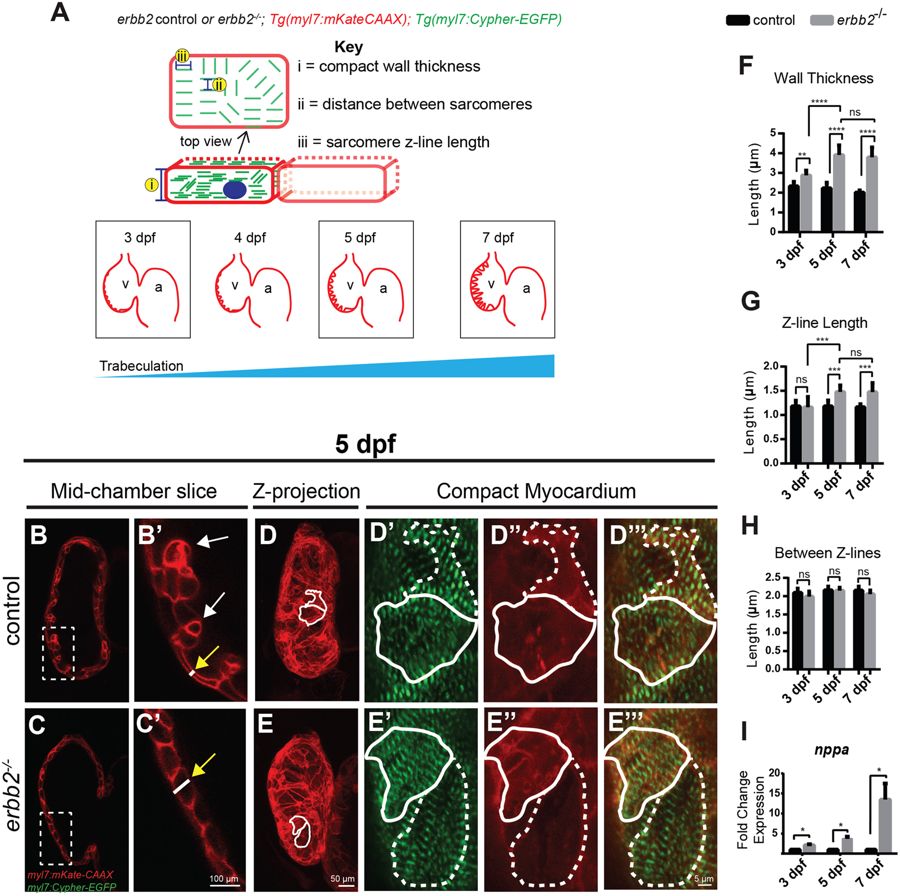
erbb2 mutant develops HL phenotypes (A) Schematic of method utilized for obtaining compact myocardial wall and myofibril measurements. (B,C) Mid-chamber confocal sections of control and erbb2−/− hearts, respectively. (B’,C’) Magnified high-resolution images of compact myocardial wall and trabecular regions marked by dotted box in B, C. Yellow arrows point to length of CM along compact myocardial wall. White arrows point to trabeculae. (D,E) Maximal projection of confocal Z-stacks of ventricle. (D’-D”’, E’-E”’) Magnified high-resolution images of compact myocardium outlined in white in D and E revealing sarcomere structures of two CMs in control and erbb2−/− ventricles, respectively. (F–H) Quantification of compact myocardial wall thickness (n = 6–10), Z-line length (n = 9–10), and distance between Z-lines (n = 8–10), at 3, 5, and 7 dpf from control and erbb2−/− hearts. (I) Expression of nppa in whole hearts isolated from erbb2 control or erbb2−/− larvae (n = 10–15). Data are represented as mean ± SEM. *p ≤ 0.05, **p = 0.0025, ***p = 0.0004 and ****p < 0.0001 by Student’s t test. v, ventricle; a, atrium.