
|
Fig. 4
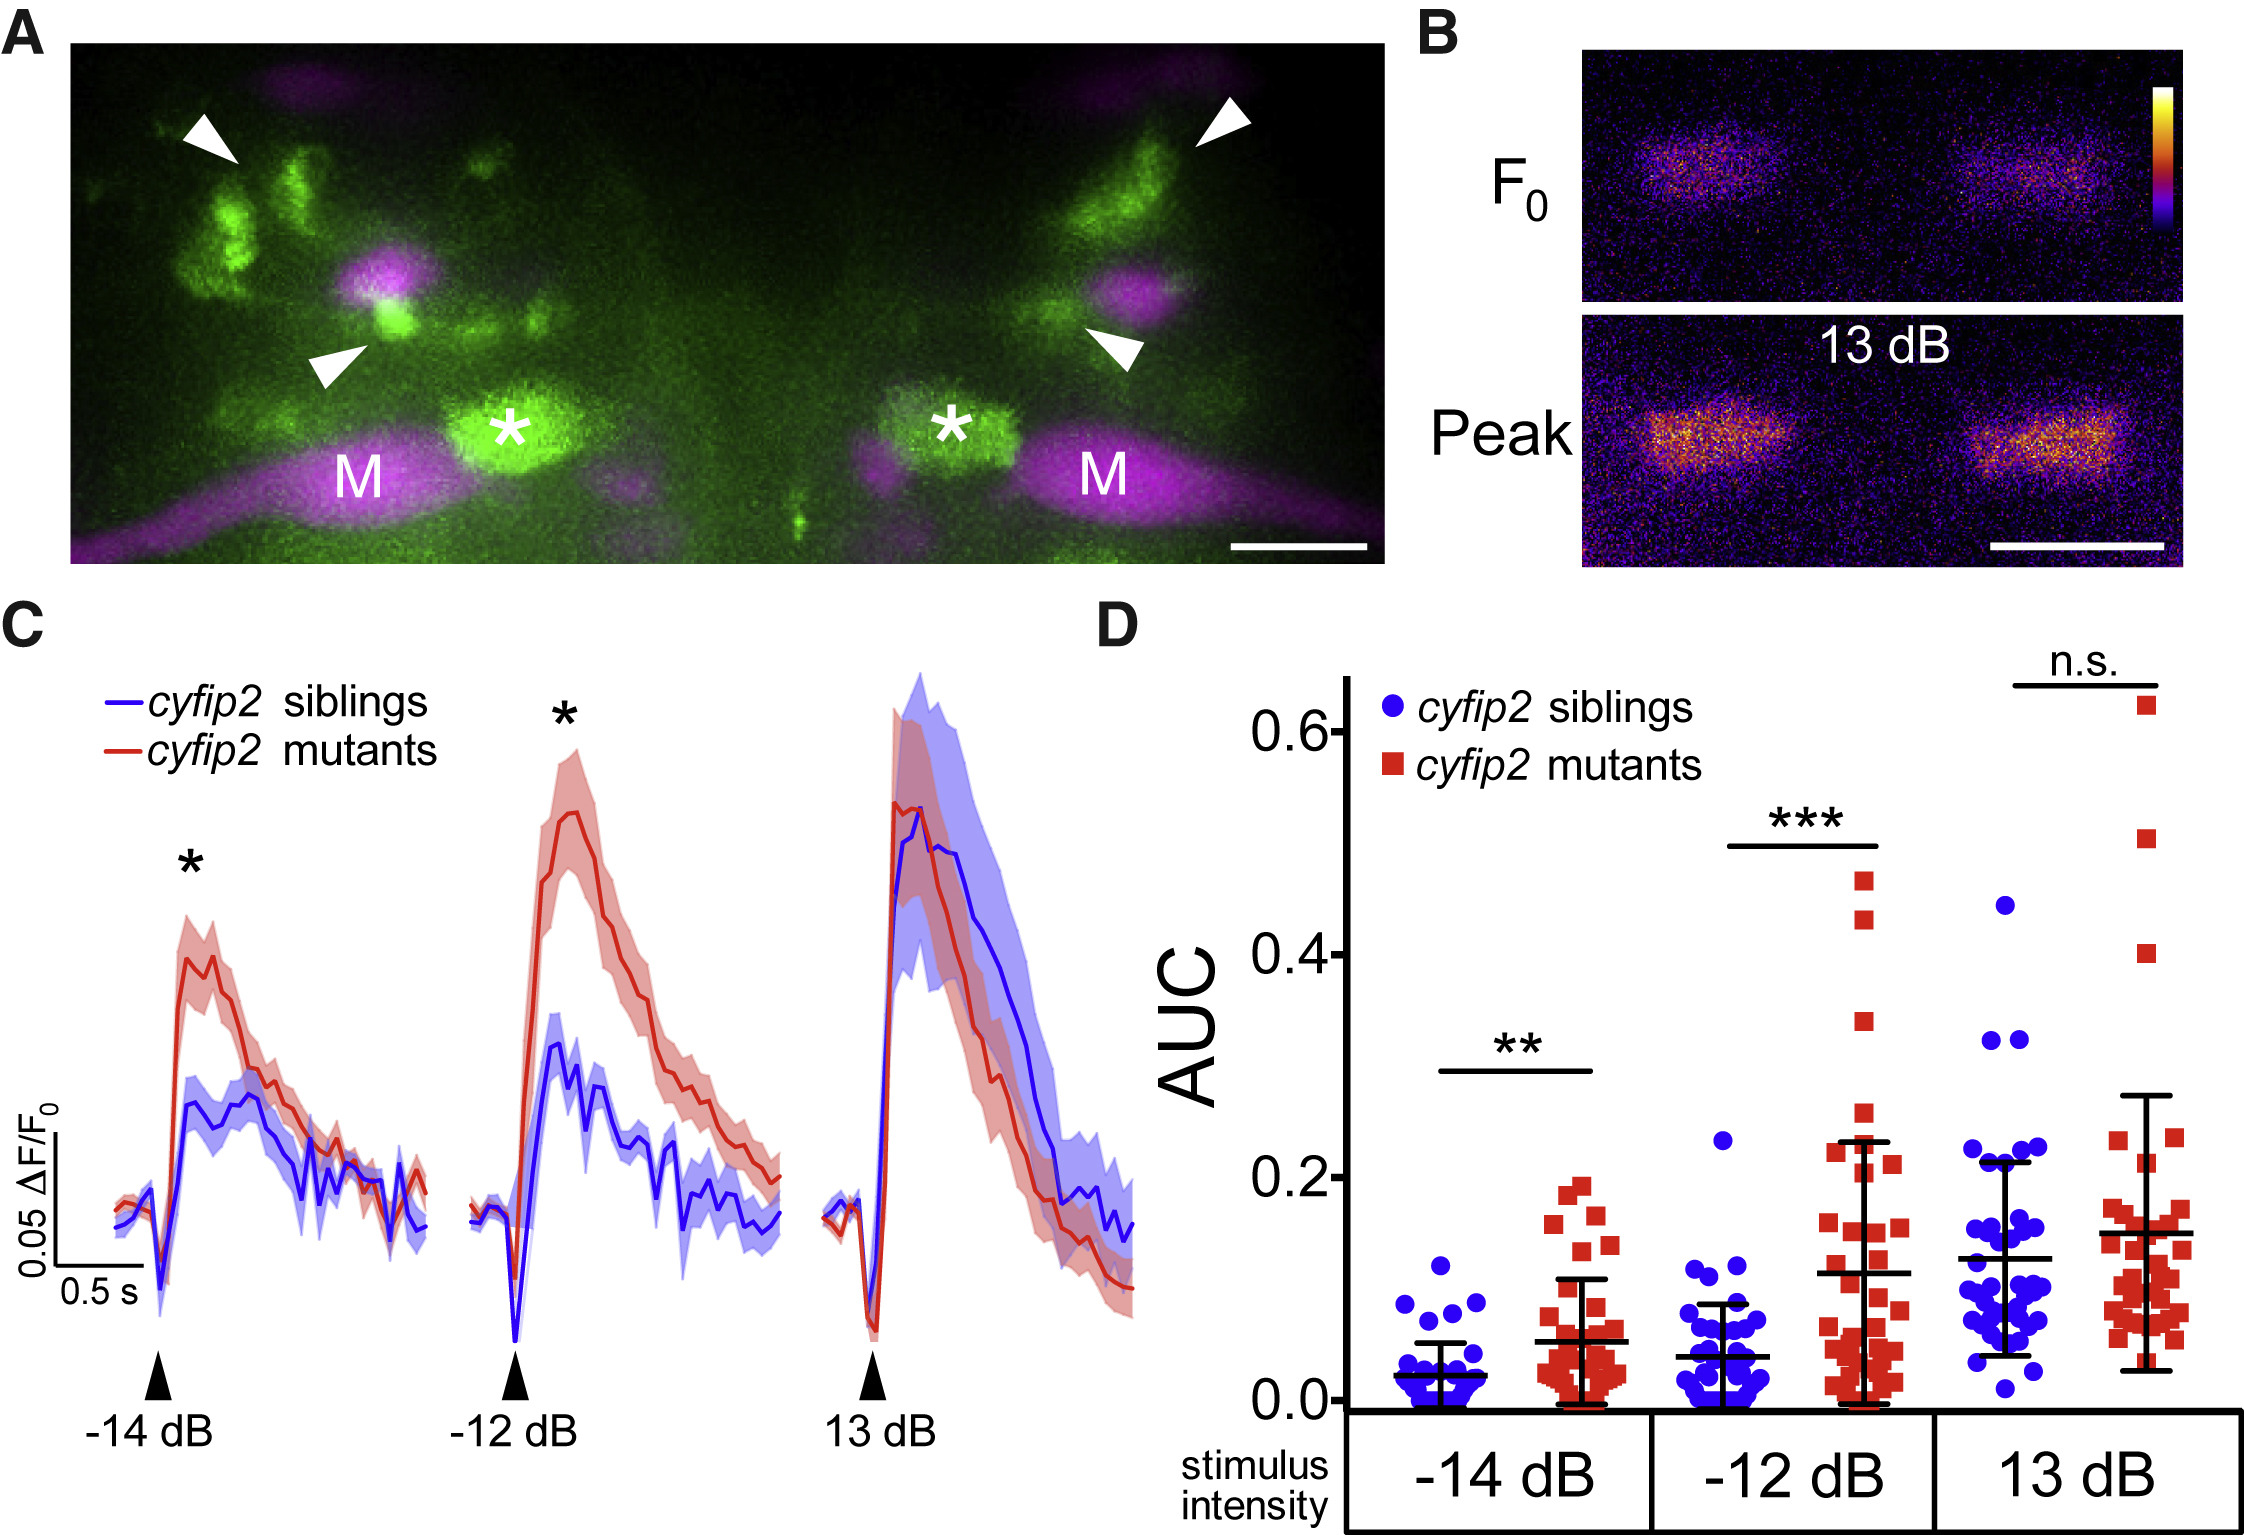
SF Axon Terminal Activity Is Increased in cyfip2 Mutants
(A) Maximum intensity projection of Tg(−6.7FRhcrtR:gal4VP16); Tg(UAS:GCaMP5), showing labeled SF neurons (green). M-cells (M) and other reticulospinal neurons were labeled with rhodamine dextran (magenta). Arrowheads indicate SF cell bodies, and asterisks mark SF axon terminals in the M-cell axon cap. Scale bar, 10 μm.
(B) Representative pseudocolored images of baseline (F0) and peak fluorescence in SF axon terminals following a strong acoustic stimulus (13 dB; the color scale denotes fluorescence intensity; black, lowest; white, highest). Scale bar, 10 μm.
(C) Averaged traces of SF terminal Ca2+ responses following low (−14 dB), medium (−12 dB), and strong (13 dB) acoustic stimuli (n = 42 responses from 10 siblings, blue line; n = 36 responses from 9 mutants, red line; mean ± SEM; ∗p < 0.05, Mann-Whitney test).
(D) Scatterplot of the area under the curve for individual SF axon terminal Ca2+ responses (mean ± SD; ∗∗p = 0.0049, ∗∗∗p = 0.0003, Mann-Whitney test).