
Fig. 4
- ID
- ZDB-IMAGE-180709-19
- Publication
- Zhang et al., 2018 - Synaptically silent sensory hair cells in zebrafish are recruited after damage
- All Figures
- Figures for Zhang et al., 2018
|
Fig. 4
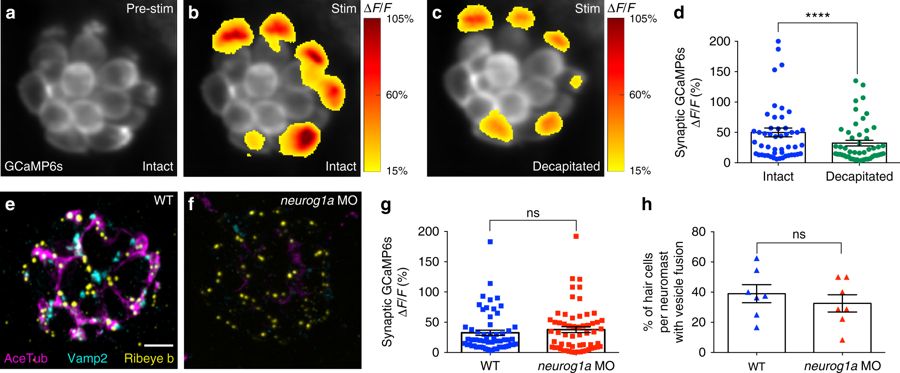
The proportion of active cells is not dependent on innervation. a–c Presynaptic Ca2+ profiles of a representative neuromast in response to a 2-s 5 Hz (anterior–posterior directed square wave) stimulus that activates all hair cells, before (b) and after decapitation to eliminate efferent activity (c). Spatial patterns of GCaMP6s Ca2+ activities during stimulation are colorized according to the ∆F/F heat map and superimposed onto the baseline GCaMP6s image (a). d Presynaptic Ca2+ responses before (49.90% ± 7.24) and after decapitation (32.31% ± 4.70), n = 50 cells, p < 0.0001. Immunostaining of a wild-type (WT, e) and neurog1a morphant (MO, f) neuromast. Ribeye b labels presynaptic ribbons (yellow), Acetylated Tubulin (AceTub, magenta) labels afferent neurons, and Vamp2 (cyan) labels efferent neurons. The neurog1 morphants lack afferent (magenta) and efferent (cyan) innervation. g There is no significant difference in the magnitude of the presynaptic Ca2+ responses between the WT (32.64% ± 4.36) and neurog1a morphants (37.73% ± 4.93), n = 59 hair cells, p = 0.79. h There is no significant difference in the percentage of hair cells with vesicle fusion per neuromast between WT (38.94% ± 5.97) and neurog1a morphants (32.53% ± 5.75), n = 7 neuromasts, p = 0.45. A Wilcoxon test was used in d, a Mann–Whitney test in g, and an unpaired t-test in h; ****p < 0.0001. Scale bars = 5 μm