
Fig. S7
- ID
- ZDB-IMAGE-180705-60
- Publication
- Williams et al., 2018 - Gon4l regulates notochord boundary formation and cell polarity underlying axis extension by repressing adhesion genes
- All Figures
- Figures for Williams et al., 2018
|
Fig. S7
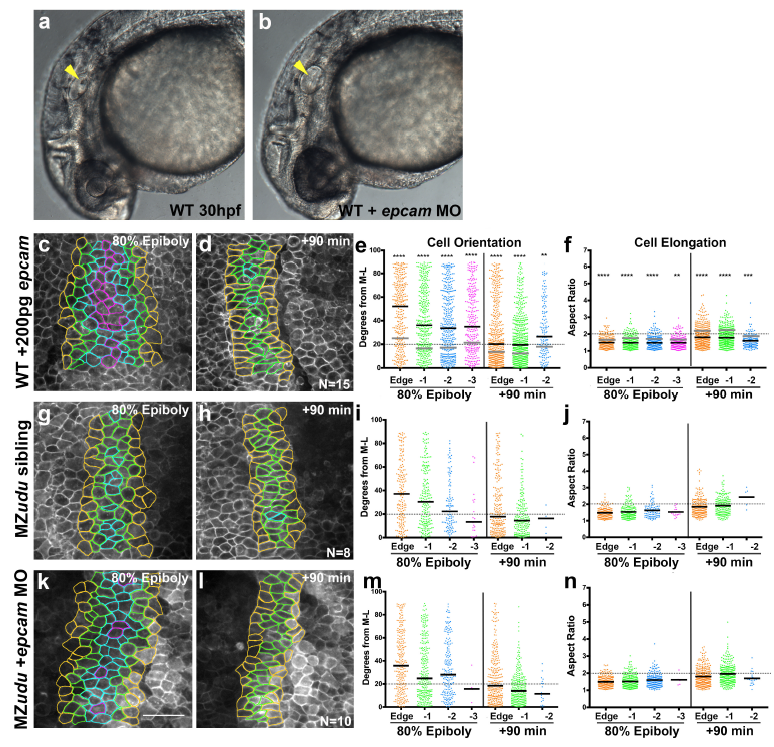
Reduction of EpCAM does not suppress cell polarity defects in MZudu-/- gastrulae
a-b) Live images of otic vesicles in WT embryos at 30hpf either (a) uninjected or (b) injected with 1ng epcam MO. Arrowheads mark otoliths (or lack thereof). Approximately 36% of epcam MO-injected embryos from three independent trials lacked otoliths as shown in b, an additional 56% exhibited smaller otoliths (both phenotypes are observed in epcam mutants2). c-f) Quantification of axial mesoderm cell orientation (e) and elongation (f) in epcam overexpressing WT gastrulae. Asterisks indicate significant differences compared to WT controls (Kolmogorov-Smirnov (e) and Mann-Whitney (f) tests, **p<0.01, ***p<0.001, ****p<0.0001). Black bars are median values in e, mean values in f; medians and means of WT are shown as gray bars in e-f. g-n) Quantification of axial mesoderm cell orientation and elongation in control MZudu-/- siblings (g-j) and MZudu-/- injected with 1ng epcam MO (k-n) at the time points indicated. Graphs and color coding as in Fig. 3. Bars are median values in i, m; bars are mean values in j, n. N indicates the number of embryos analyzed, scale bar is 50μm.