
Fig. 4
- ID
- ZDB-IMAGE-180705-51
- Publication
- Williams et al., 2018 - Gon4l regulates notochord boundary formation and cell polarity underlying axis extension by repressing adhesion genes
- All Figures
- Figures for Williams et al., 2018
|
Fig. 4
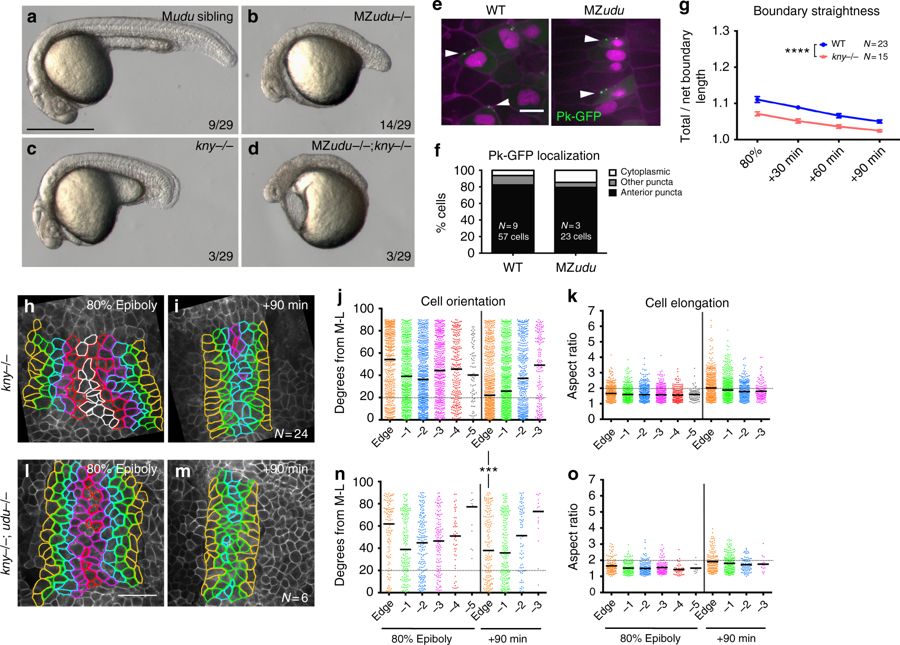
Gon4l regulates axis extension independent of PCP signaling. a–d Live embryos at 24 hpf resulting from a cross between a germline-replaced udu−/−;kny fr6/+ female and an udu+/-;knyfr6/+ male. Genotypes are indicated in the upper right corner, fractions indicate the number of embryos in the clutch with the pictured phenotype. e Mosaically expressed Prickle (Pk)-GFP in WT and MZudu−/− gastrulae. Arrowheads indicate anteriorly localized Pk-GFP puncta. Membrane Cherry marks cell membranes, nuclear-RFP marks cells injected with pk-gfp RNA. Images are representative of three independent experiments. f Quantification of Pk-GFP localization shown in e (chi-square, p = 0.07). g Quantification of notochord boundary straightness in WT and kny−/− gastrulae. Symbols are means with SEM (two-way ANOVA, ****p < 0.0001). h, i, l, m Still images from live time-lapse confocal movies of the axial mesoderm in kny−/− (h–i) and kny−/−;udu−/− (l–m) gastrulae at the time points indicated. Cell outlines are colored as in Fig. 3. j, n Quantification of axial mesoderm cell orientation as in Fig. 3, bars are median values (Kolmogorov–Smirnov test, ***p = 0.0003). k, o Quantification of axial mesoderm cell elongation as in Fig. 3, bars are mean values. N indicates number of embryos analyzed (and number of cells in f). Scale bar is 500 μm in a–d, 10 μm in e, 50 μm in h–m