
Image
|
Figure Caption
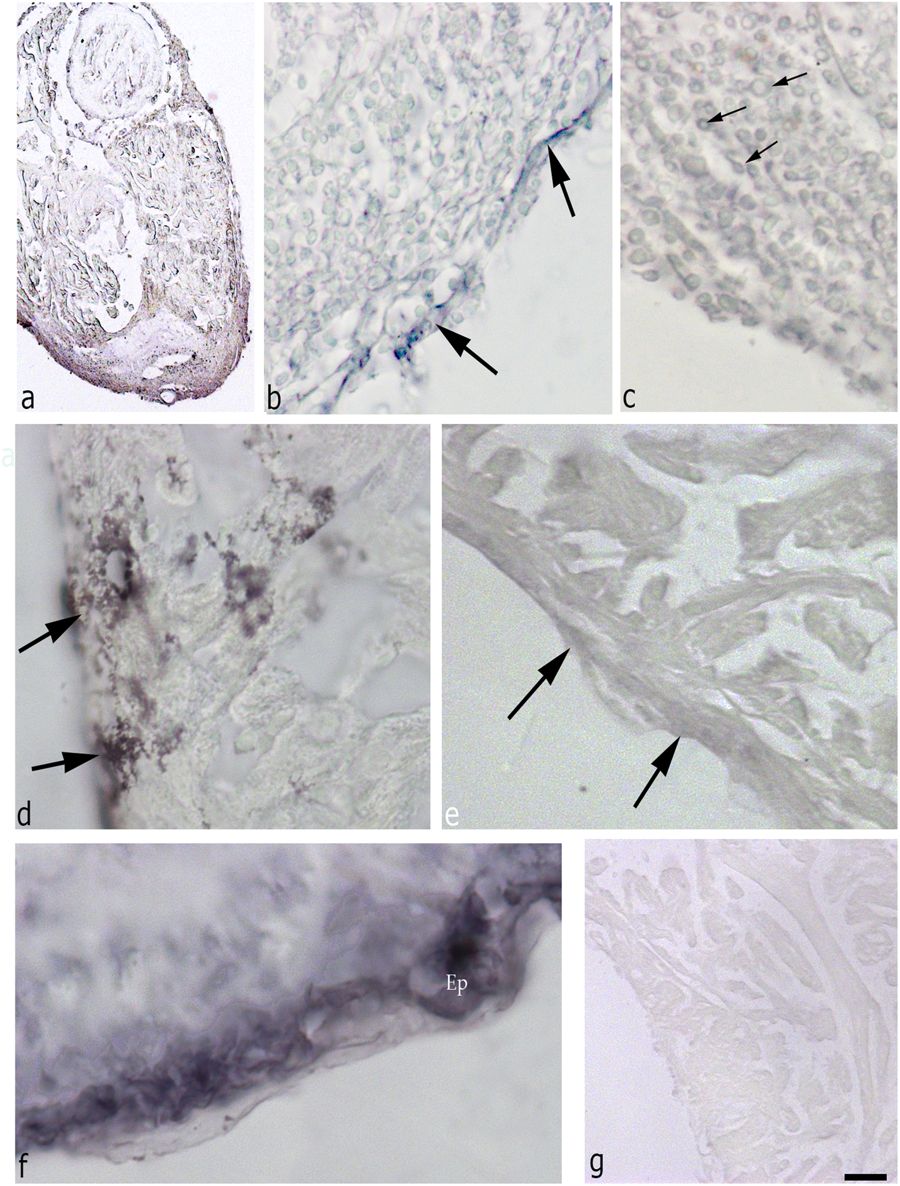
Fig. 5
Immunohistochemistry with WT1 on regenerative heart (a bar = 300 µm; b bar = 150 µm; c bar = 75 µm; d bar = 45 µm; e bar = 50 µm; f bar = 45 µm; g bar = 150 µm). At 2 days, (a) there is a strong reactivity in the epicardium surrounding the organ. This positivity is present also in EPCs surrounding the clot (b) and in cells inside the clot (c). At 3 dpa, (d) the epicardium is reactive, but at 7 dpa (e) the signal in some epicardial portions is lower as compared with the parts next to the RC (f). In g, the control staining (bar = 75 µm). Ep epicardium
Acknowledgments
This image is the copyrighted work of the attributed author or publisher, and
ZFIN has permission only to display this image to its users.
Additional permissions should be obtained from the applicable author or publisher of the image.
Full text @ Cell Death Discov