
|
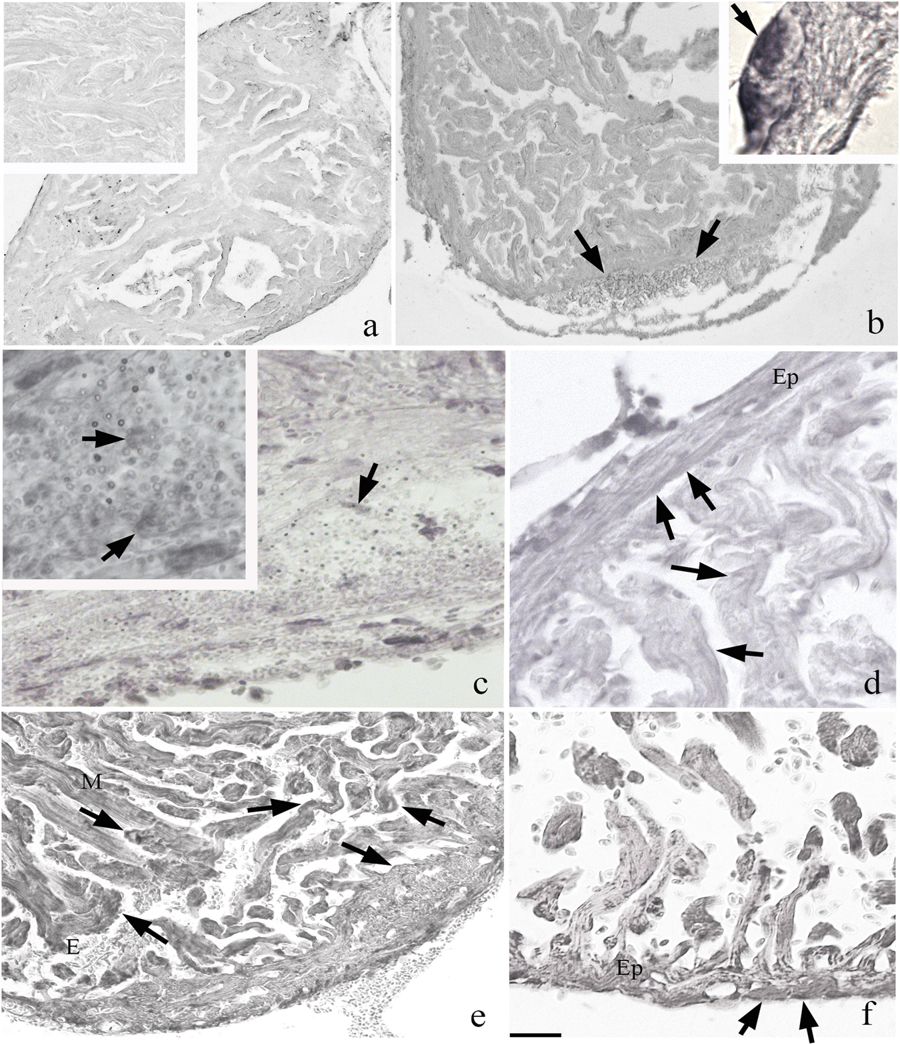
Fig. 4
Immunohistochemistry with HSP70 on zebrafish heart. a HSP70 staining in the control. The reaction is marked in the samples of 2 and 3 dpa (b and d, respectively); in particular in the regions of the clot (c, and inset) and epicardium (Ep) (b, inset). In the region of cutting are visible at 2 dpa many rounded positive cells. From 14 days (f) onwards, the clot has almost disappeared and replaced by new myocytes (M); is visible to the evidenced several erythrocytes in the heart lumen (e). At days 30, (f) positivity is still reactive than in the control (a bar = 300 μm; inset = 75 μm; b bar = 300 μm and inset bar = 4 μm; c bar = 75 μm and inset bar = 45 μm; d bar = 150 μm and bar = 150 μm; f bar = 75 μm)