
IMAGE
Fig. S1
- ID
- ZDB-IMAGE-180621-38
- Genes
- Publication
- Wang et al., 2018 - Lpar2b Controls Lateral Line Tissue Size by Regulating Yap1 Activity in Zebrafish
- All Figures
- Figures for Wang et al., 2018
Image
|
Figure Caption
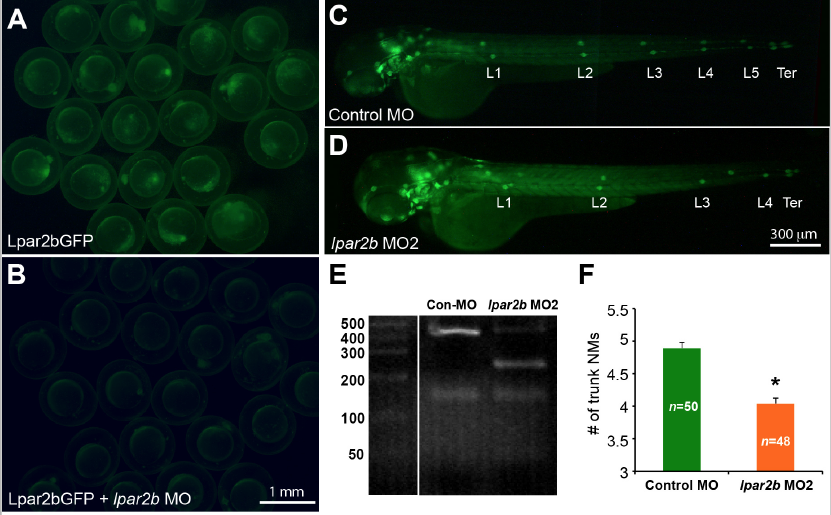
Fig. S1
Validation of the efficacy of the MOs used in the study. (A-‐B) Fluorescence images showing 8-‐hpf embryos injected with the Lpar2bGFP construct (A) alone, or together with lpar2b MO (B). (C,D) Epifluorescence images of control MO-‐ or lpar2b MO2-‐injected Et(gata2:EGFP)mp189b embryos at 48 hpf. (E) The splicing-‐blocking lpar2b MO2 disrupts normal slicing of the lpar2b pre-‐mRNA as shown by RT-‐PCR. (F) Quantification of the number of NMs at 48 hpf in (C,D). *, p < 0.05 compared to control.
Figure Data
Acknowledgments
This image is the copyrighted work of the attributed author or publisher, and
ZFIN has permission only to display this image to its users.
Additional permissions should be obtained from the applicable author or publisher of the image.
Full text @ Front. Mol. Neurosci.