
Fig. 4
- ID
- ZDB-IMAGE-180621-35
- Genes
- Publication
- Wang et al., 2018 - Lpar2b Controls Lateral Line Tissue Size by Regulating Yap1 Activity in Zebrafish
- All Figures
- Figures for Wang et al., 2018
|
Fig. 4
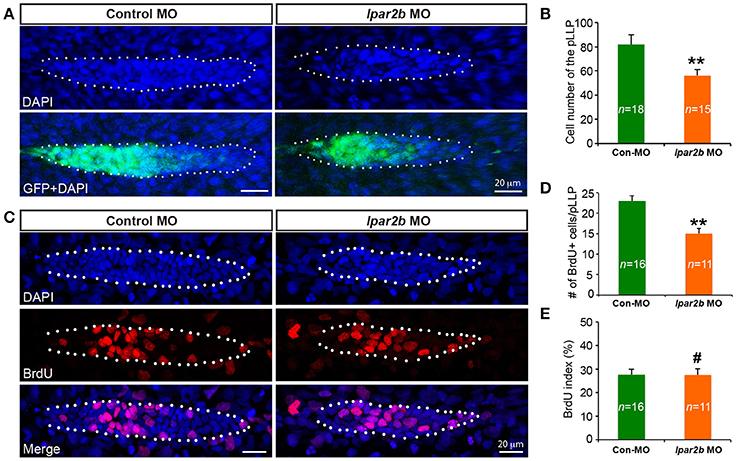
Lpar2b regulates the tissue size of the pLLP. (A) Confocal images showing the pLLP of control- or lpar2b MO-injected Et(gata2:EGFP)mp189b embryos at 32 hpf. The embryos were stained with DAPI to show cell nuclei (blue). GFP comes from the gata2:EGFP transgene. The pLLP is outlined by dots. (B) Quantification of the total number of cells in the pLLP. (C) Confocal images of the pLLP at 32 hpf after DAPI (blue) and BrdU (red) staining. (D) Quantification of the number of BrdU+ cells in the pLLP. (E) The BrdU index is calculated as (number of BrdU+ cells in pLLP)/(total number of pLLP cells). Con-MO, Control MO; **p < 0.01; #p > 0.05 compared to control.