
Fig. 7
- ID
- ZDB-IMAGE-180509-16
- Genes
- Publication
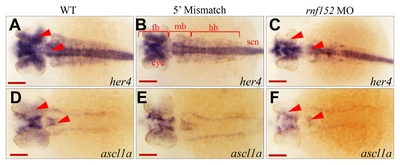
- Kumar et al., 2017 - Rnf152 Is Essential for NeuroD Expression and Delta-Notch Signaling in the Zebrafish Embryos
- All Figures
- Figures for Kumar et al., 2017
|
Fig. 7
(A–F) Dorsal view of embryos at 29 hpf. WISH analysis with