
Fig. 5-S2
- ID
- ZDB-IMAGE-180504-6
- Genes
- Publication
- Montague et al., 2017 - Vg1-Nodal heterodimers are the endogenous inducers of mesendoderm
- All Figures
- Figures for Montague et al., 2017
|
Fig. 5-S2
Vg1 and Nodal are only active when co-expressed.
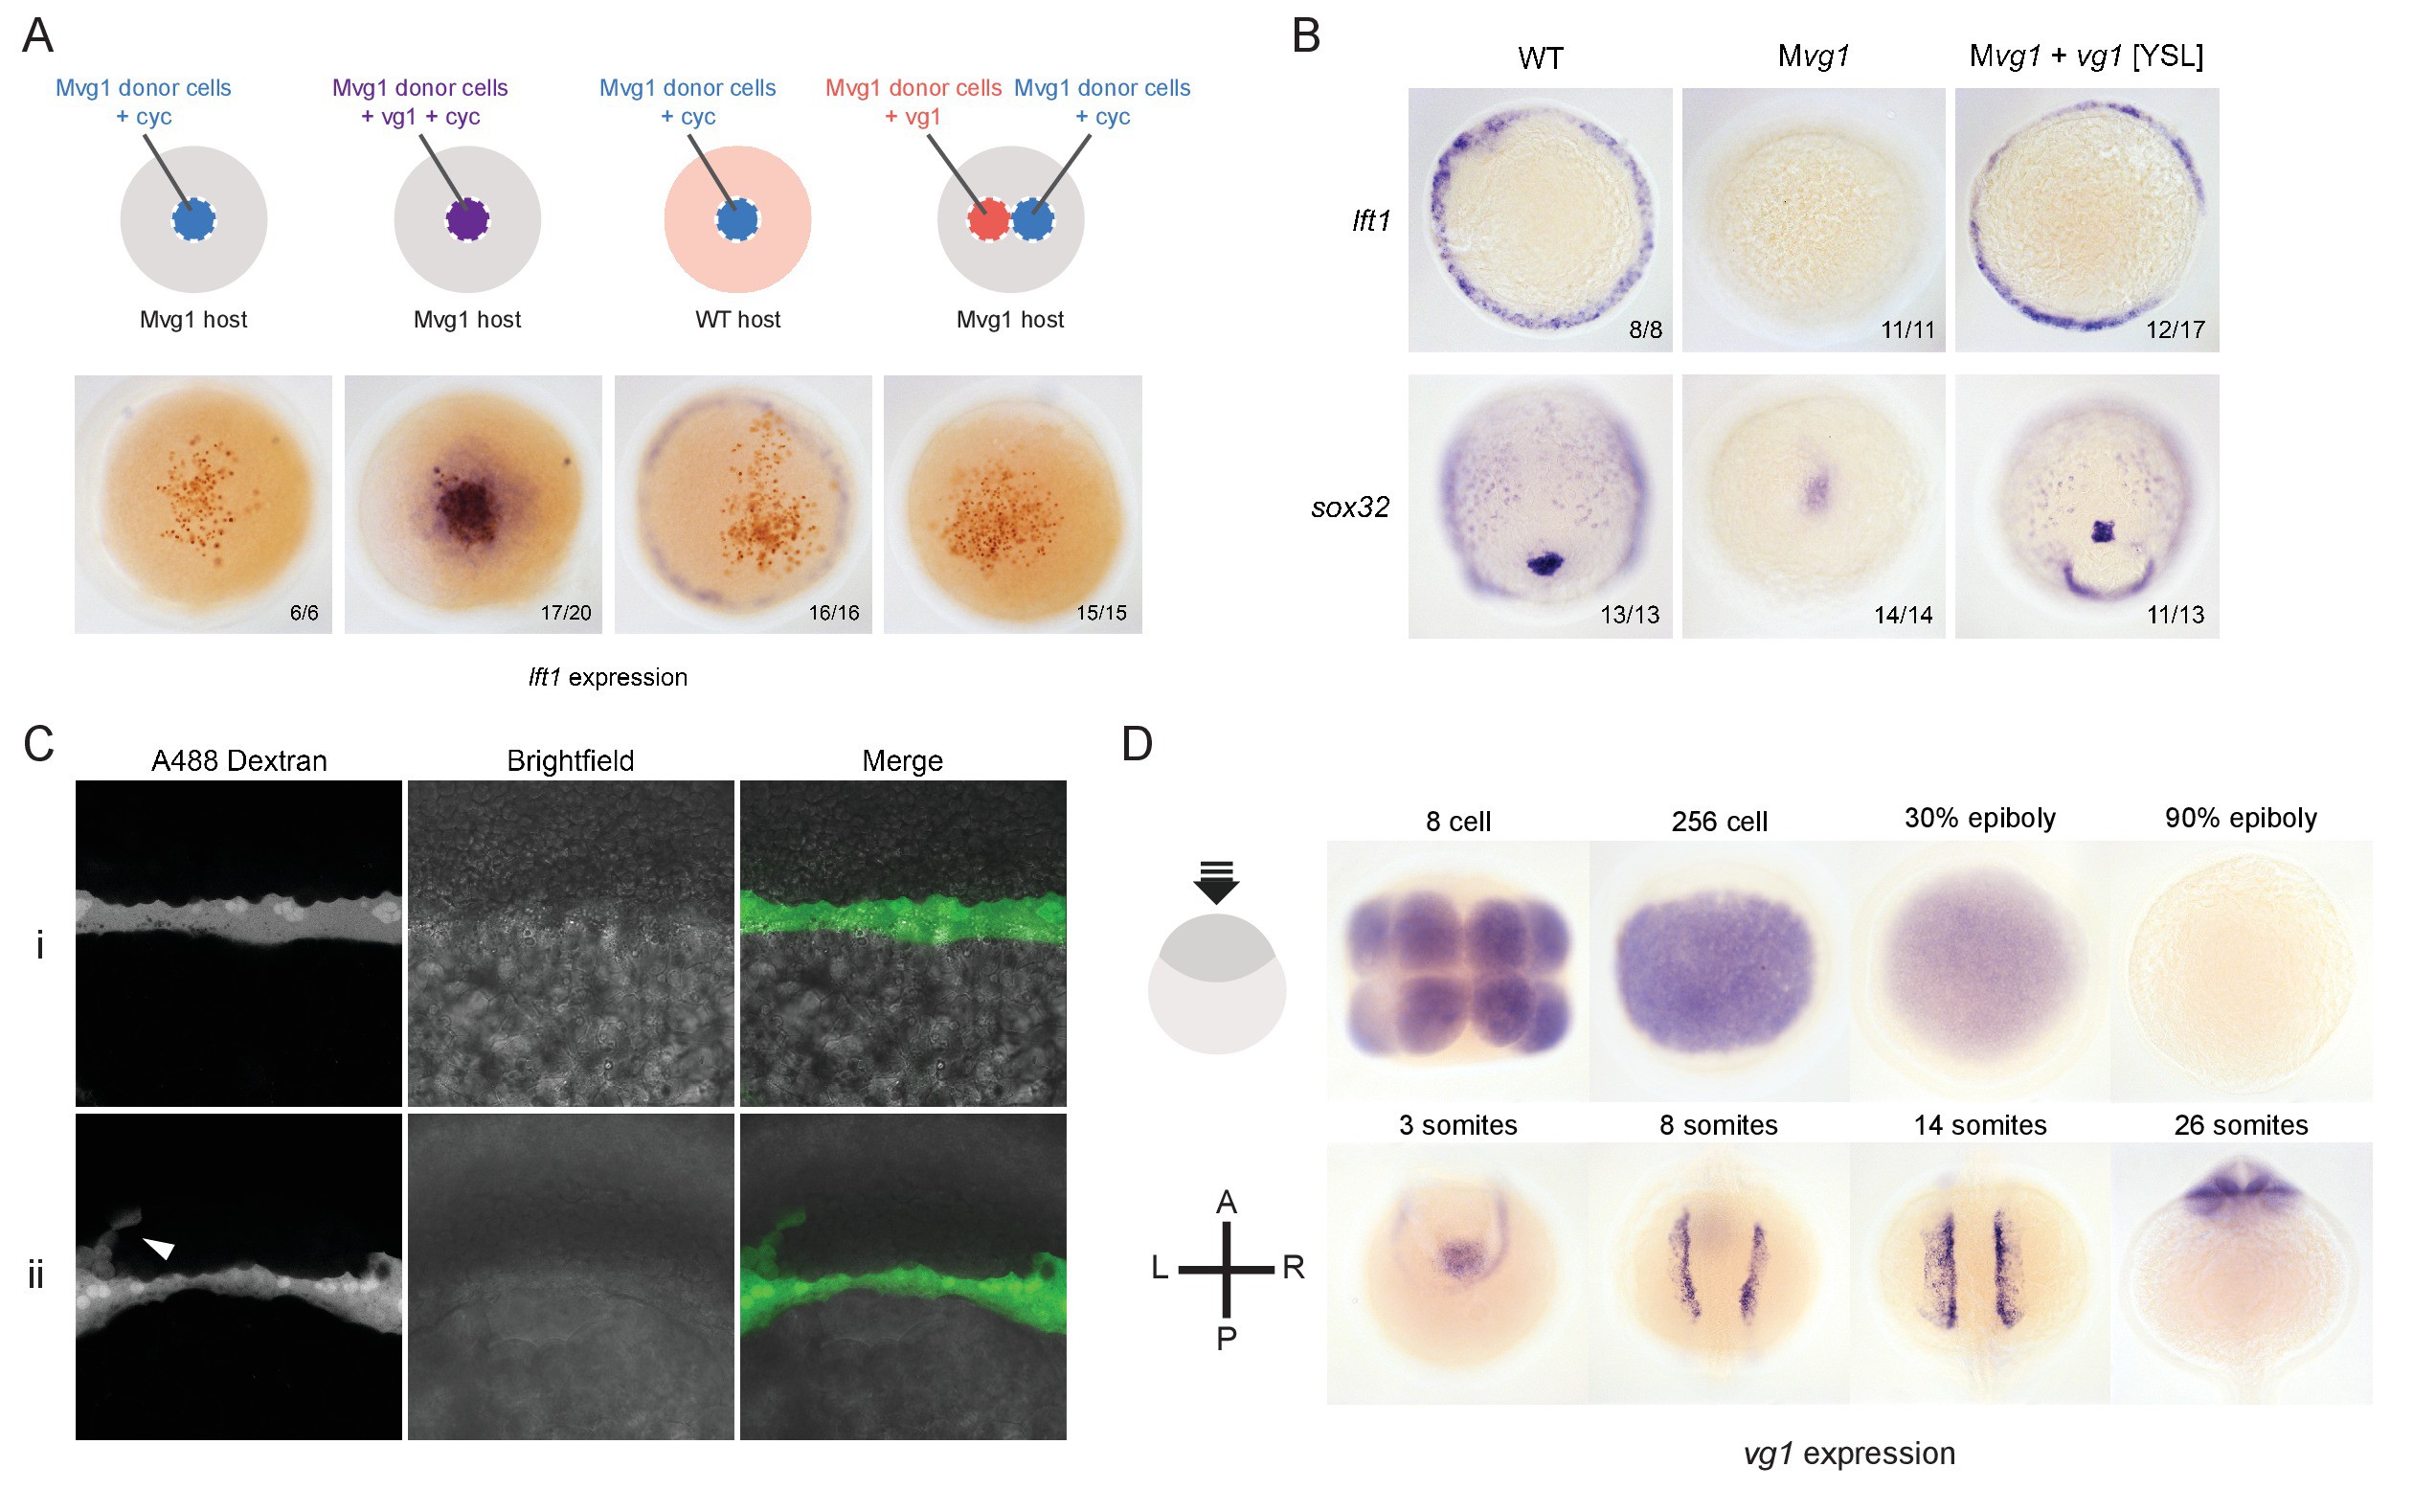
(A) Transplantation experiments with DAB staining to show the location of the transplanted cells (orange) and lft1 expression (purple). (B) in situ hybridizations for a mesoderm marker (lft1) and an endoderm marker (sox32) in vg1 mRNA YSL-injected embryos. (C) Confocal imaging of Mvg1 embryos injected with 100 pg of vg1 and 500 pg of Alexa 488 dextran into the embryonic YSL at the 1000-cell stage. The majority of fluorescent dextran localized to the YSL (i), but in some cases dextran was detectable in a few margin cells (ii, white arrowhead). (D) Endogenous vg1 expression in WT embryos.