
Fig. 4
- ID
- ZDB-IMAGE-180426-3
- Genes
- Publication
- Ji et al., 2017 - Involvement of Lypge in the formation of eye and pineal gland in zebrafish
- All Figures
- Figures for Ji et al., 2017
|
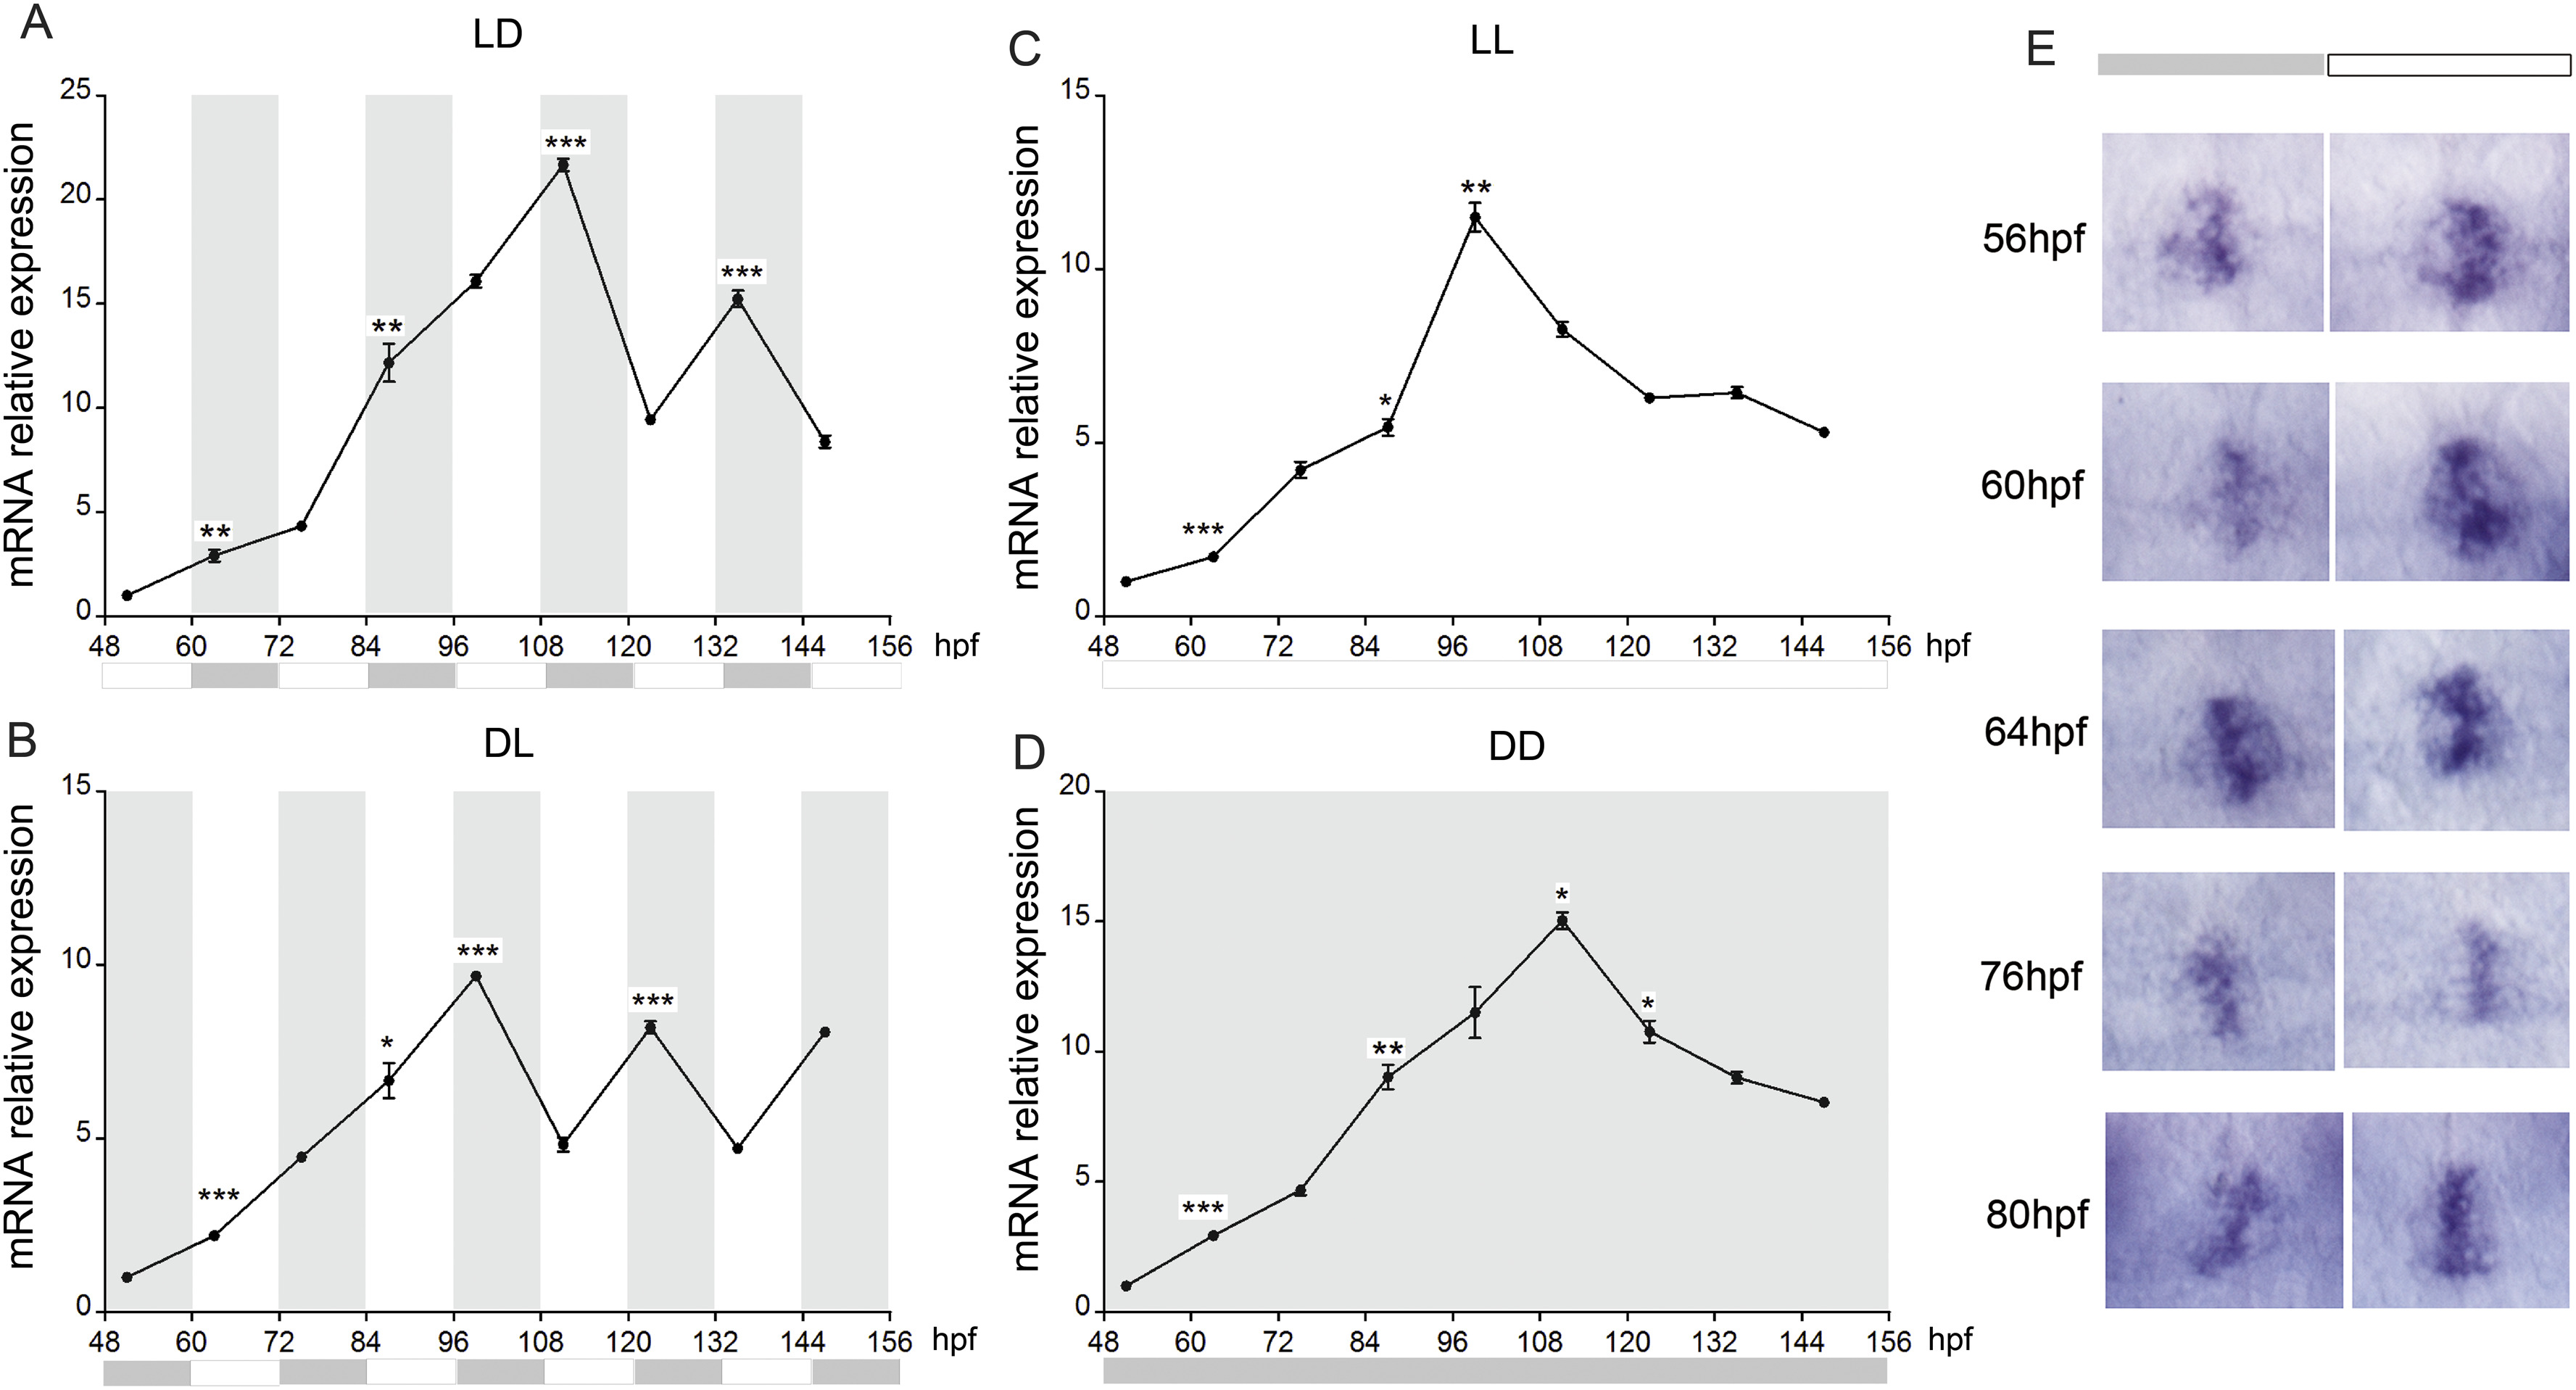
Fig. 4 Assay for rhythmic Expression of lypge. (A–D) Expression is examined by qRT-PCR in different light-dark cycles (A: LD, B: DL, C: LL, D: DD). White and gray backgrounds represent light and dark phases. Zebrafish larvae were collected at two time points per day between 2 and 6 dpf. Embryos were sampled at zeitgeber time (ZT) 3 and 15. Statistically significant differences between the expression peak and through on each day (Fisher's t-test) are indicated:*P < 0.05, **P < 0.01, ***P < 0.001. Error bars indicate s.e.m. (E) Embryos are expose to continuous light or dark after 48 hpf and its expression in pineal gland is detected at different time.
Reprinted from Gene, 642, Ji, D., Wang, S., Li, M., Zhang, S., Li, H., Involvement of Lypge in the formation of eye and pineal gland in zebrafish, 491-497, Copyright (2017) with permission from Elsevier. Full text @ Gene