
Image
|
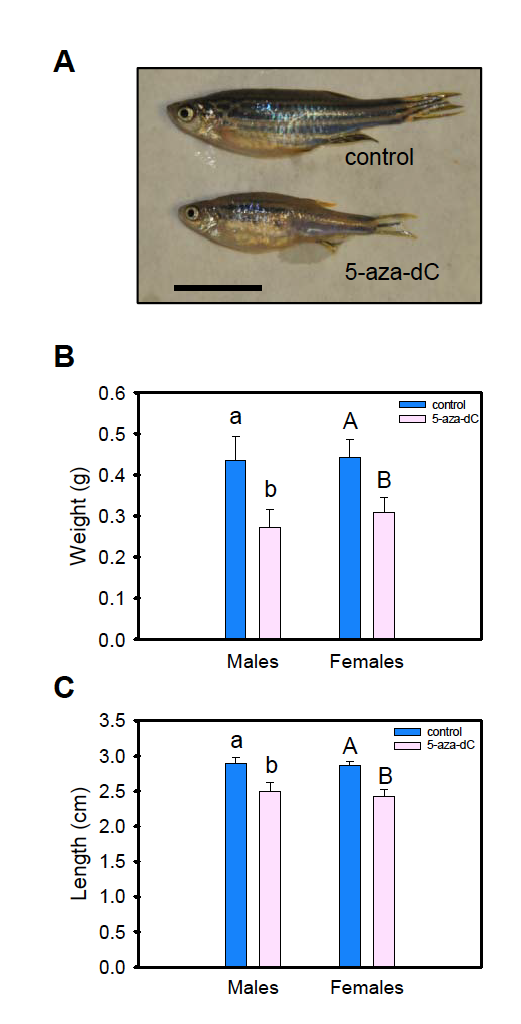
Figure Caption
Fig. S1
Effects of zebrafish treatment with 5-aza-dC at 75 µM during the period of gonadal development (10–30 dpf). (A) External differences between control and 5-aza-dC-treated adult zebrafish females at 90 dpf. Scale in cm. (B) Body weight and (C) standard length of adults at 90 dpf. Data shown as mean ± s.e.m. (n = 8 and 6 males, and 11 and 4 females in control and 5-aza-dC groups, respectively). Within each sex, significant differences (P < 0.05 for males and P < 0.01 for females) in growth were determined by the Student’s t test and are indicated by different letters.
Acknowledgments
This image is the copyrighted work of the attributed author or publisher, and
ZFIN has permission only to display this image to its users.
Additional permissions should be obtained from the applicable author or publisher of the image.
Full text @ Epigenetics Chromatin