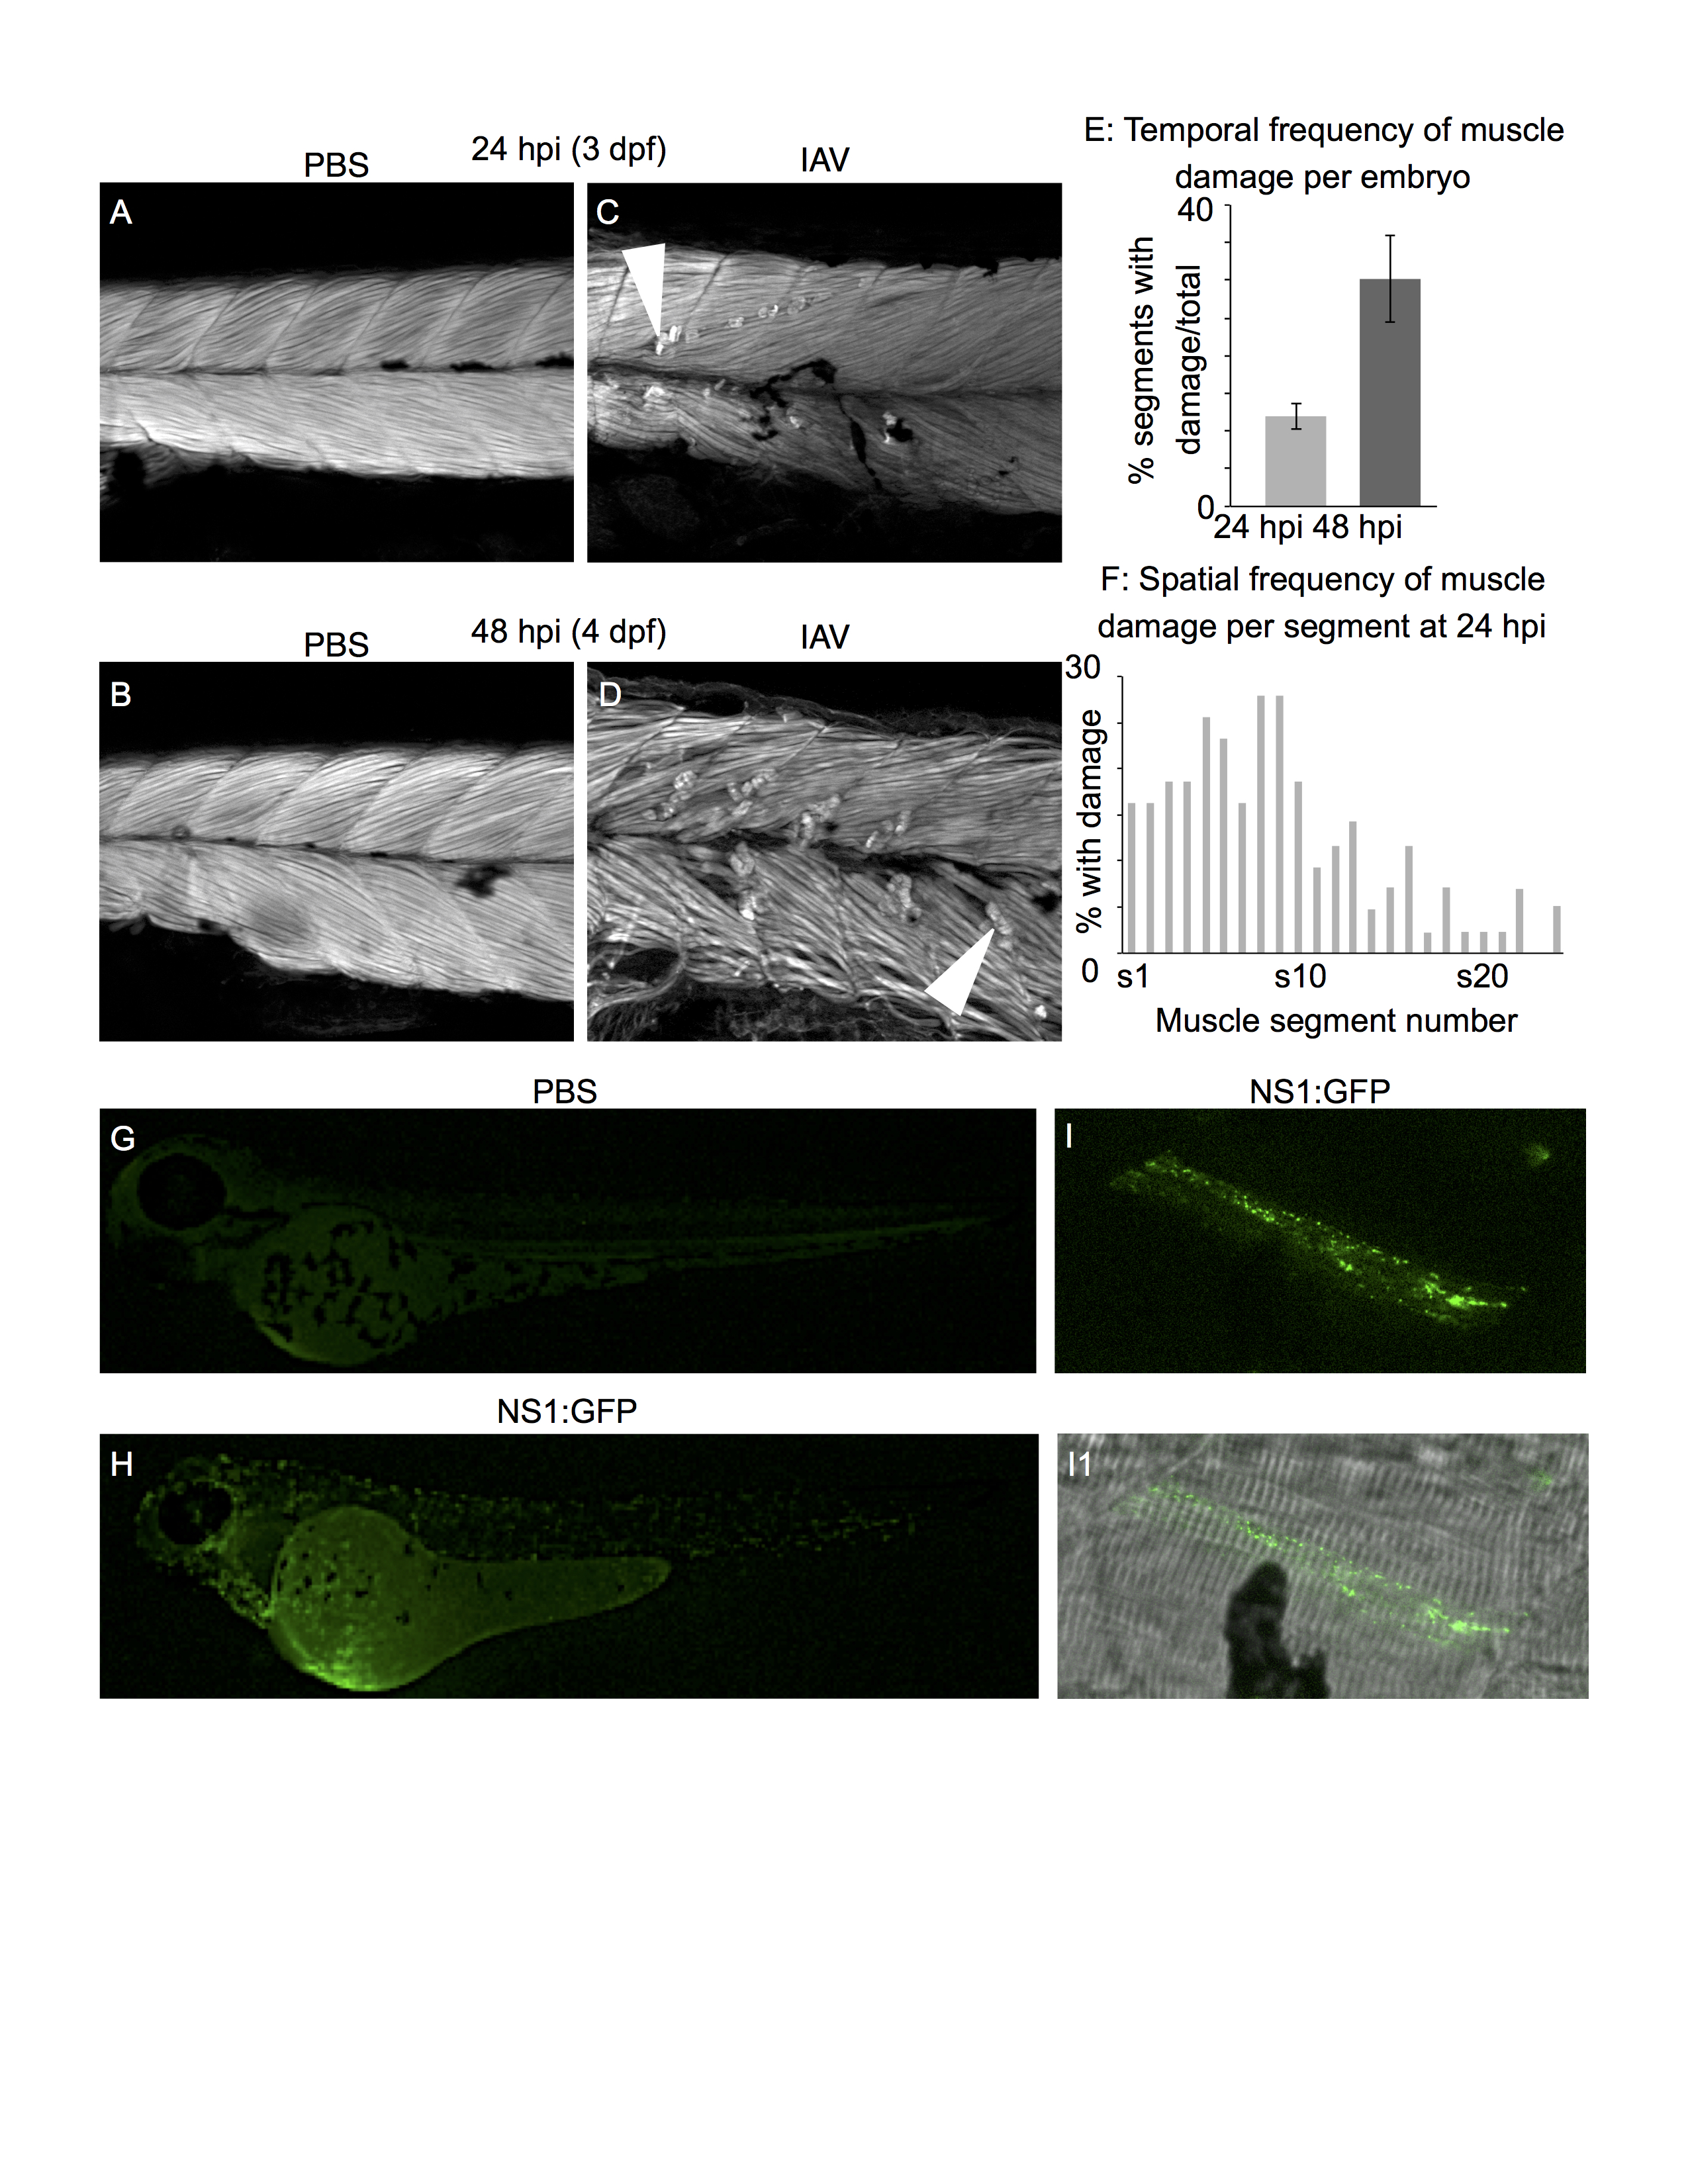
Fig. 1 Human IAV infects zebrafish muscle cells and causes muscle fiber damage All embryo images are side mounts, dorsal top, anterior left. Panels A-D are phalloidin stained to visualize F-actin. White arrowheads denote retracted fibers. (A) PBS-injected control at 24 hpi (3 dpf). (B) PBS-injected control at 48 hpi (4 dpf). (C) IAV-infected embryo at 24 hpi. (D) IAV-infected embryo at 48 hpi. (E) Quantification of the proportion of muscle segments per embryo with damaged fibers in IAV-infected embryos over developmental time. Fiber damage is more frequently observed at 48 hpi than at 24 hpi. (F) Spatial location of damaged fibers along the anterior-posterior axis of IAV-infected embryos at 24 hpi. The frequency of damaged fibers peaks in segments 5-9, which is in the anterior of the fish near the Duct of Cuvier (the site of injection). (G) PBS-injected control at 24 hpi (3 dpf). (H) NS1-GFP-injected zebrafish at 24 hpi. Note the punctate green fluorescence in infected cells throughout the body. (I) NS1-GFP-injected zebrafish at 24 hpi. Higher magnification view of a GFP-positive, infected muscle fiber. (I1) Merged panel of NS1-GFP and brightfield images.
Image
Figure Caption
Figure Data
Acknowledgments
This image is the copyrighted work of the attributed author or publisher, and
ZFIN has permission only to display this image to its users.
Additional permissions should be obtained from the applicable author or publisher of the image.
Full text @ PLoS Curr.

