
|
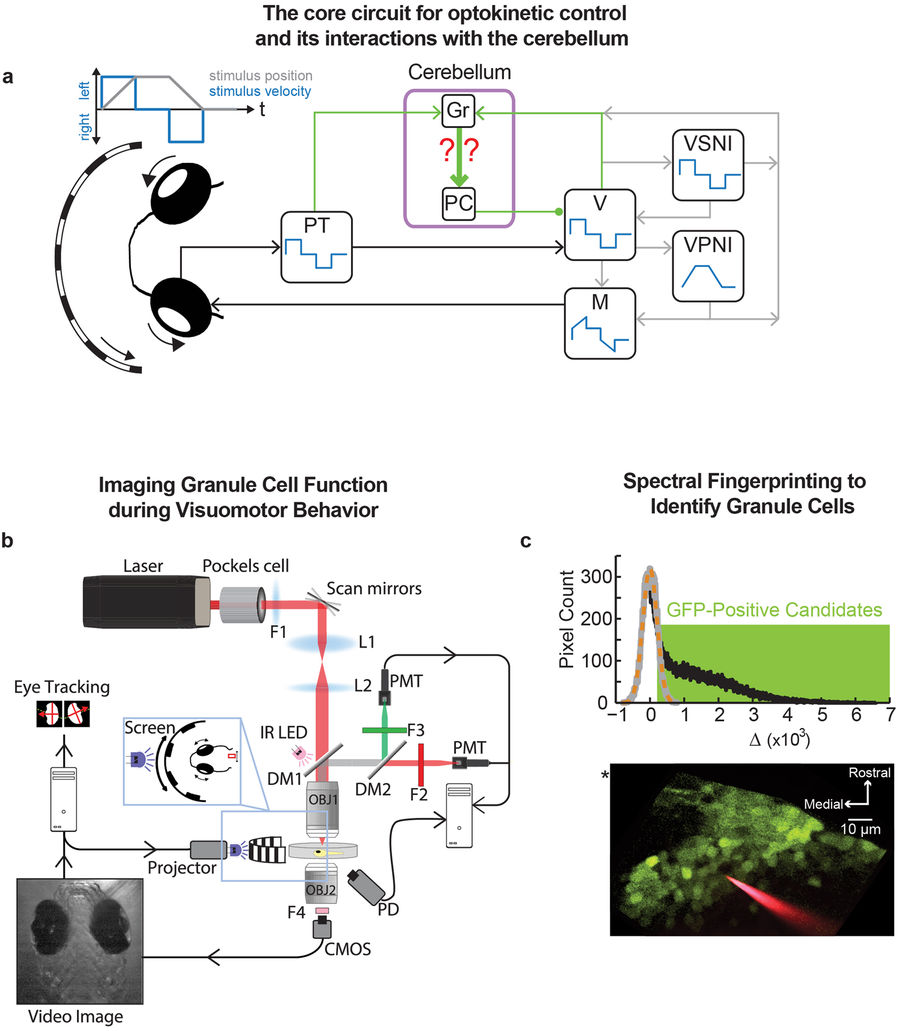
Fig. 1
Imaging the signaling properties of transgenically identified granule cells during oculomotor control. (a) Current understanding of the signal flow underlying the control of optokinetic behavior. The core sensorimotor elements of the circuit are the pretectum (PT), second-order vestibular nuclei (V), the velocity-storage neural integrator (VSNI), and the velocity-to-position neural integrator (VPNI). Adaptations in oculomotor behavior are mediated by the Purkinje (PJ) and granule (Gr) cells of the cerebellum. In the mammal, pretectal signals and stimulus information processed in a cortical path are combined at the dorsolateral pontine nucleus before being sent to the cerebellum22. Filled circle - inhibitory connections; arrows – excitatory connections; for simplicity, callosal projections not explicitly indicated. (b) Experimental setup. Two-photon excitation with a Ti-Sapphire laser tuned to the infrared frequency range enables simultaneous fluorescence microscopy of granule cell function, behavioral stimulation, and eye-movement tracking. Abbreviations OBJ: objective, L: lens, F: filter, PMT: photomultiplier tube, PD: photodetector, DM: dichroic mirror, IR LED: infrared light emitting diode. (c) Spectral finger-printing procedure allowing identification of GFP-positive granule neurons. (Top) A histogram of the pixel-by-pixel differences in intensity (uint16) between two excitation wavelengths (, black) was compared to the histogram of differences expected from noise (grey) (fit of noise histogram as dashed orange line). Pixels with difference values one noise standard deviation or more from zero were considered GFP-positive candidates (green box). (Bottom) Candidate GFP-positive pixels (green), at one image plane, identified in the inner granule layer (IGL) of the right lobe of the transgenic zebrafish cerebellum. Also visible is an electrode for glutamate iontophoresis (red). The location of the center of the midbrain-hindbrain border (*) is visible at the upper left.