
Image
|
Figure Caption
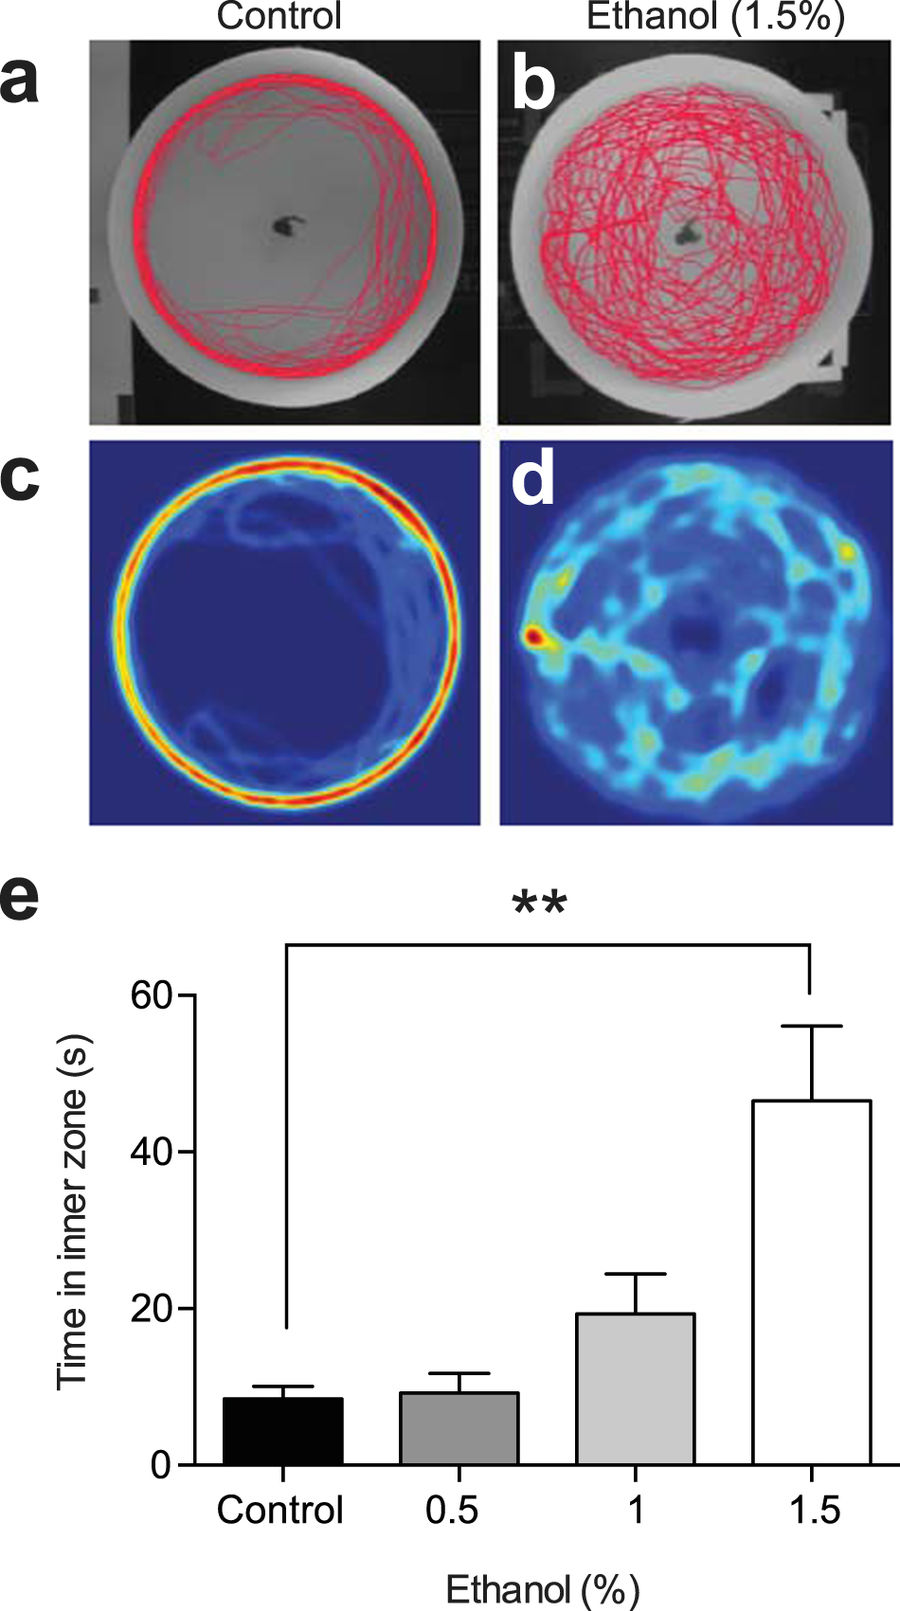
Fig. 1
Ethanol decreases anxiety in the novel approach test. (a) Trackplot of an individual control zebrafish behaviour in the 5 minute trial. (b) Trackplot of an individual zebrafish exposed to 1.5% ethanol. (c) Heatmap (coloured representation of zebrafish location over the trial) for the same fish shown in (a). (d) Heatmap for the same fish shown in (b). (e) Time fish spent in the inner zone containing the novel object for different doses of ethanol. **P < 0.01, Kruskal-Wallis test with Dunn’s multiple comparison post hoc test.
Figure Data
Acknowledgments
This image is the copyrighted work of the attributed author or publisher, and
ZFIN has permission only to display this image to its users.
Additional permissions should be obtained from the applicable author or publisher of the image.
Full text @ Sci. Rep.