
Fig. s2
- ID
- ZDB-IMAGE-180323-7
- Publication
- Barone et al., 2017 - An Effective Feedback Loop between Cell-Cell Contact Duration and Morphogen Signaling Determines Cell Fate
- All Figures
- Figures for Barone et al., 2017
|
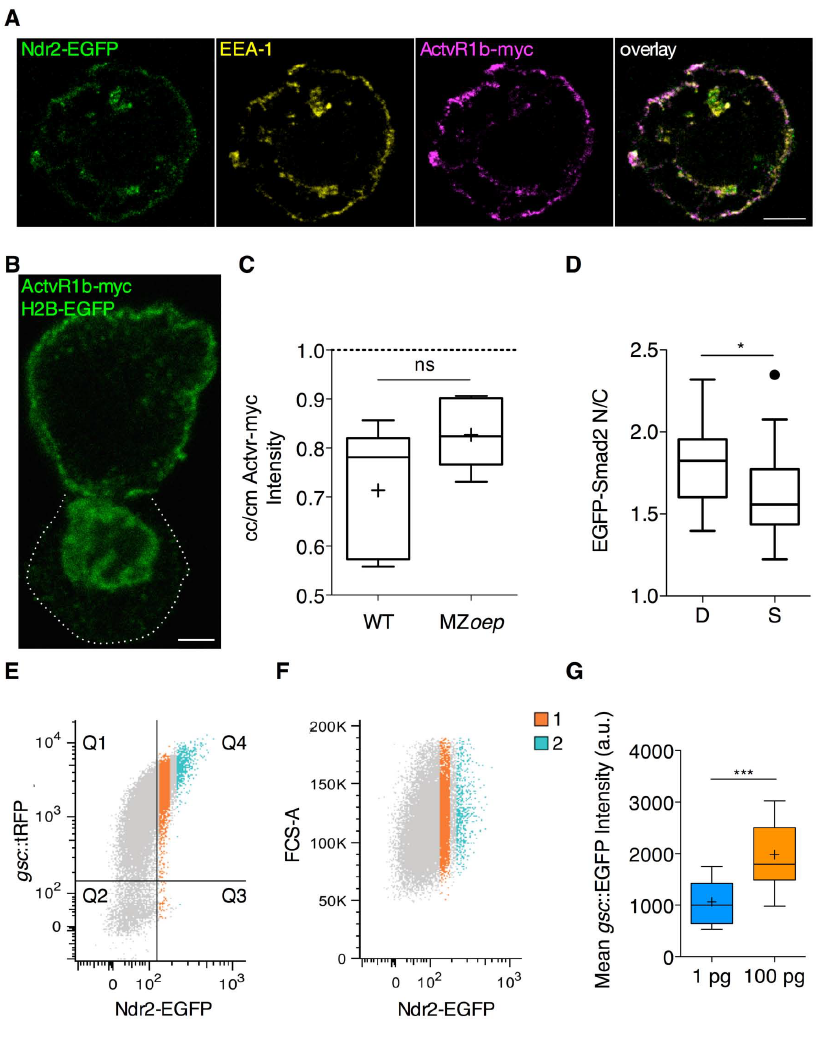
Fig. s2 Localization of Nodal signaling pathway components in ppl cells in vitro and FACS sorting strategy for Ndr2-EGFP expressing cells. Related to Figure 2 and 3.
(A) Confocal image of a ppl single cell isolated from embryos over-expressing Ndr2-EGFP and ActvR1b-myc at 6 hpf and kept in culture for 60 min, showing uniform subcellular localization of Ndr2-EGFP relative to ActvR1b-myc and EEA1 visualized by immunohistochemistry. Scale bar, 5 μm. (B) Confocal image of a ppl cell doublet isolated from MZoep embryos over-expressing ActvR1b-myc at 3 hpf, exposed to Activin and kept in culture for 60 min after FACS sorting, showing of ActvR1b-myc visualized by immunohistochemistry in the top cell. The bottom cell (outlined by white dashed line) only expresses H2B-EGFP to mark its nucleus. Scale bar, 5 μm. (C) Intensity ratios of Actvr1b-myc on the plasma membrane at cell-cell (cc) versus cell-medium (cm) interfaces of ppl cell doublets obtained from WT embryos and MZoep embryos and kept in culture for 60 min. Values are shown as Tukey box-and-whiskers plots with median (bar) and average values (cross). n (WT), 6; n(MZoep), 6; 2 independent experiments each. (D) EGFP-Smad2 nuclear-to-cytoplasmic (N/C) ratios for cell doublets (D) and single cells (S) taken from MZoep embryos expressing EGFP-Smad2 and H2B-BFP after exposure to Activin for 3h and kept in culture in the presence of Activin for 60 min after FACS isolation (equivalent to MZoep A+/A+ condition in Figure 2D). Values are shown as Tukey box-and-whiskers plots with median (bar) and average values (cross). n (single cells), 21; n (doublets), 14; 2 independent experiments. Statistical test, Student t test, two tailed; P values,*< 0.05. (E) FACS sorting strategy: mesendoderm (ppl) cells were obtained from 6 hpf Tg(gsc::tRFP) embryos injected with ndr2-GFP mRNA (100 pg/embryo) at the one-cell stage and sorted into 2 groups according to their Ndr2-EGFP expression levels. The scatter plot shows the correlation between gsc::tRFP and Ndr2-EGFP signal. Cells in Q4 are positive for both signals. FACS recording for one representative experiment. (F) Cell size control: the forward scattering signal (FCS-A) shows there is no cell size difference between cells expressing low (1) and high (2) levels of Ndr2-EGFP. FACS recording for one representative experiment. (G) Mean EGFP intensity of mesendoderm progenitor cells isolated from Tg(gsc::mEGFP) expressing either low (1 pg) or high (100 pg) levels of ndr2 mRNA and transplanted in the animal pole of host embryos at 6 hpf. Mean EGFP intensity was measured 120 minutes after transplantation at 75% epiboly stage (8 hpf). Values are shown as Tukey box-and-whiskers plots with median (bar) and average values (cross). n (1 pg), 27; n (100 pg), 26; 2 independent experiments each. Statistical test, Mann Whitney t test, two tailed. P value: ***<0.001. See also Figure 2 and 3.
Reprinted from Developmental Cell, 43(2), Barone, V., Lang, M., Krens, S.F.G., Pradhan, S.J., Shamipour, S., Sako, K., Sikora, M., Guet, C.C., Heisenberg, C.P., An Effective Feedback Loop between Cell-Cell Contact Duration and Morphogen Signaling Determines Cell Fate, 198-211.e12, Copyright (2017) with permission from Elsevier. Full text @ Dev. Cell