
Fig. 4
|
Fig. 4
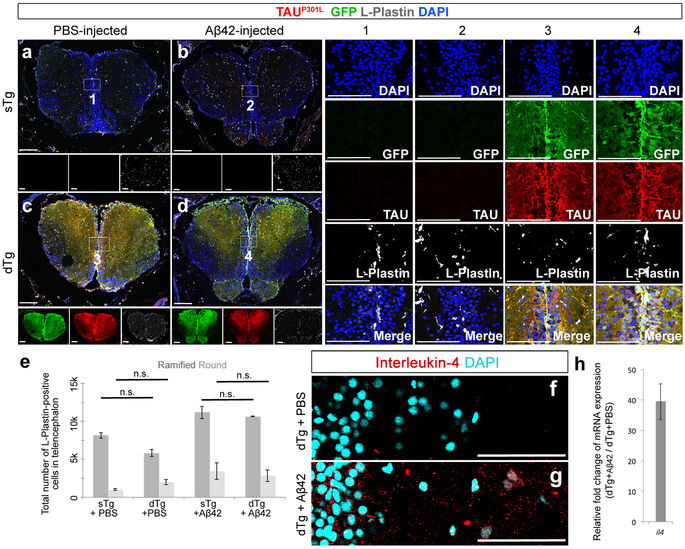
(a) Immunohistochemistry (IHC) for TAUP301L (red), GFP (green) and L-Plastin (white) on coronal sections of telencephalon of a 6 month-old sTg animal injected with PBS (a), sTg animal injected with Aβ42 (b), dTg animal injected with PBS (c), and dTg animal injected with Aβ42 (d). Insets below the panels show individual fluorescent channels for TAUP301L (red), GFP (green) and L-Plastin (white). Columns 1–4 are single and merged images of the regions indicated in (a–d), respectively. (e) Quantification of the total number of ramified and round L-Plastin-positive cells in the telencephalon of sTg and dTg animals injected with PBS or Aβ42. (f–g) Immunohistochemistry for Interleukin-4 (red) on coronal sections of telencephalon of a 6-month old dTg animal injected with PBS (f) or with Aβ42 (g). (h) Relative change in the expression levels of il4 after Aβ42 injection compared to control injection. Medial ventricular regions are shown. DAPI (cyan) marks the nuclei. Values represent mean ± s.e.m. *p < 0.05, **p < 0.01, ***p < 0.005. Scale bars equal 50 μm. n = 6 fish and > 30 histological sections for every staining. All animals are 6 months old.