
Fig. 4
- ID
- ZDB-IMAGE-180202-34
- Genes
- Publication
- Jinchao et al., 2017 - Thrombopoietic stimulating activity of rhTyrRS (Y341A)
|
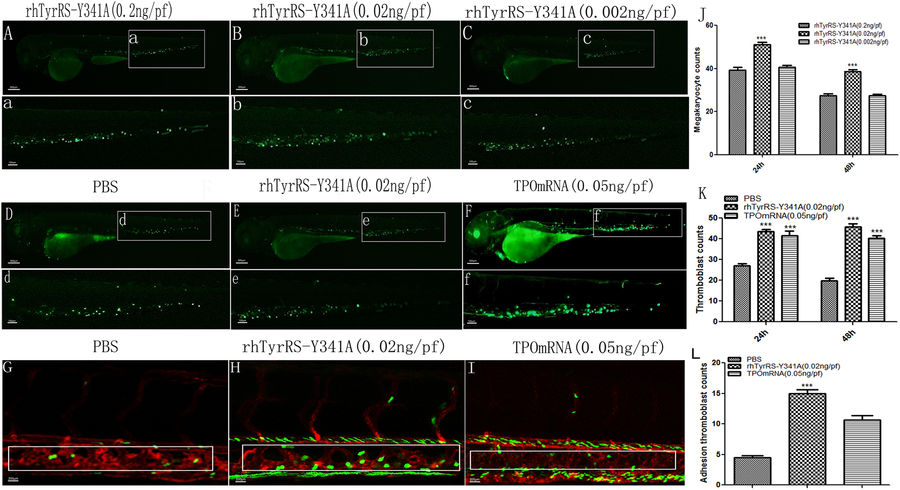
Fig. 4
The effect of rhTyrRS (Y341A) on zebrafish thromboblasts. Green areas represent the thromboblasts labeled by GFP in zebrafish. The changes in thromboblast numbers in zebrafish at 24 h after micro-injection of rhTyrRS (Y341A) (0.002, 0.02, or 0.2 ng per fish) are shown in (A,B,C). (J) Statistics on the number of thromboblasts in zebrafish at different time points (P < 0.001); the abscissa indicates the observation time after microinjection. The ordinate indicates the number of thromboblasts. The changes in thromboblast counts in the PBS, rhTyrRS (Y341A) (2 × 10⁻² ng per fish) group, and TPO mRNA (0.05 ng per fish) group at 24 h after micro-injection are shown in (D,E,F). (K) Statistics on the number of thromboblasts in zebrafish at different time points (P < 0.001). The abscissa indicates the observation time after microinjection. The ordinate indicates the number of thromboblasts. Laser confocal microscope observation of thromboblast adhesion to vascular endothelial cells 24 h after micro-injection. (G) PBS group. (H) rhTyrRS (Y341A) (0.02 ng per fish) group. (I) TPO mRNA (0.05 ng per fish) group. (L) Statistics on the number of thromboblasts adhering to vascular endothelial cells in caudal hematopoietic tissue. The abscissa indicates the observation time after micro-injection; the ordinate indicates the number of thromboblast adhesion (***P < 0.001).