
Fig. 6
- ID
- ZDB-IMAGE-180123-35
- Genes
- Publication
- Yan et al., 2017 - CD146 is required for VEGF-C-induced lymphatic sprouting during lymphangiogenesis
- All Figures
- Figures for Yan et al., 2017
|
Fig. 6
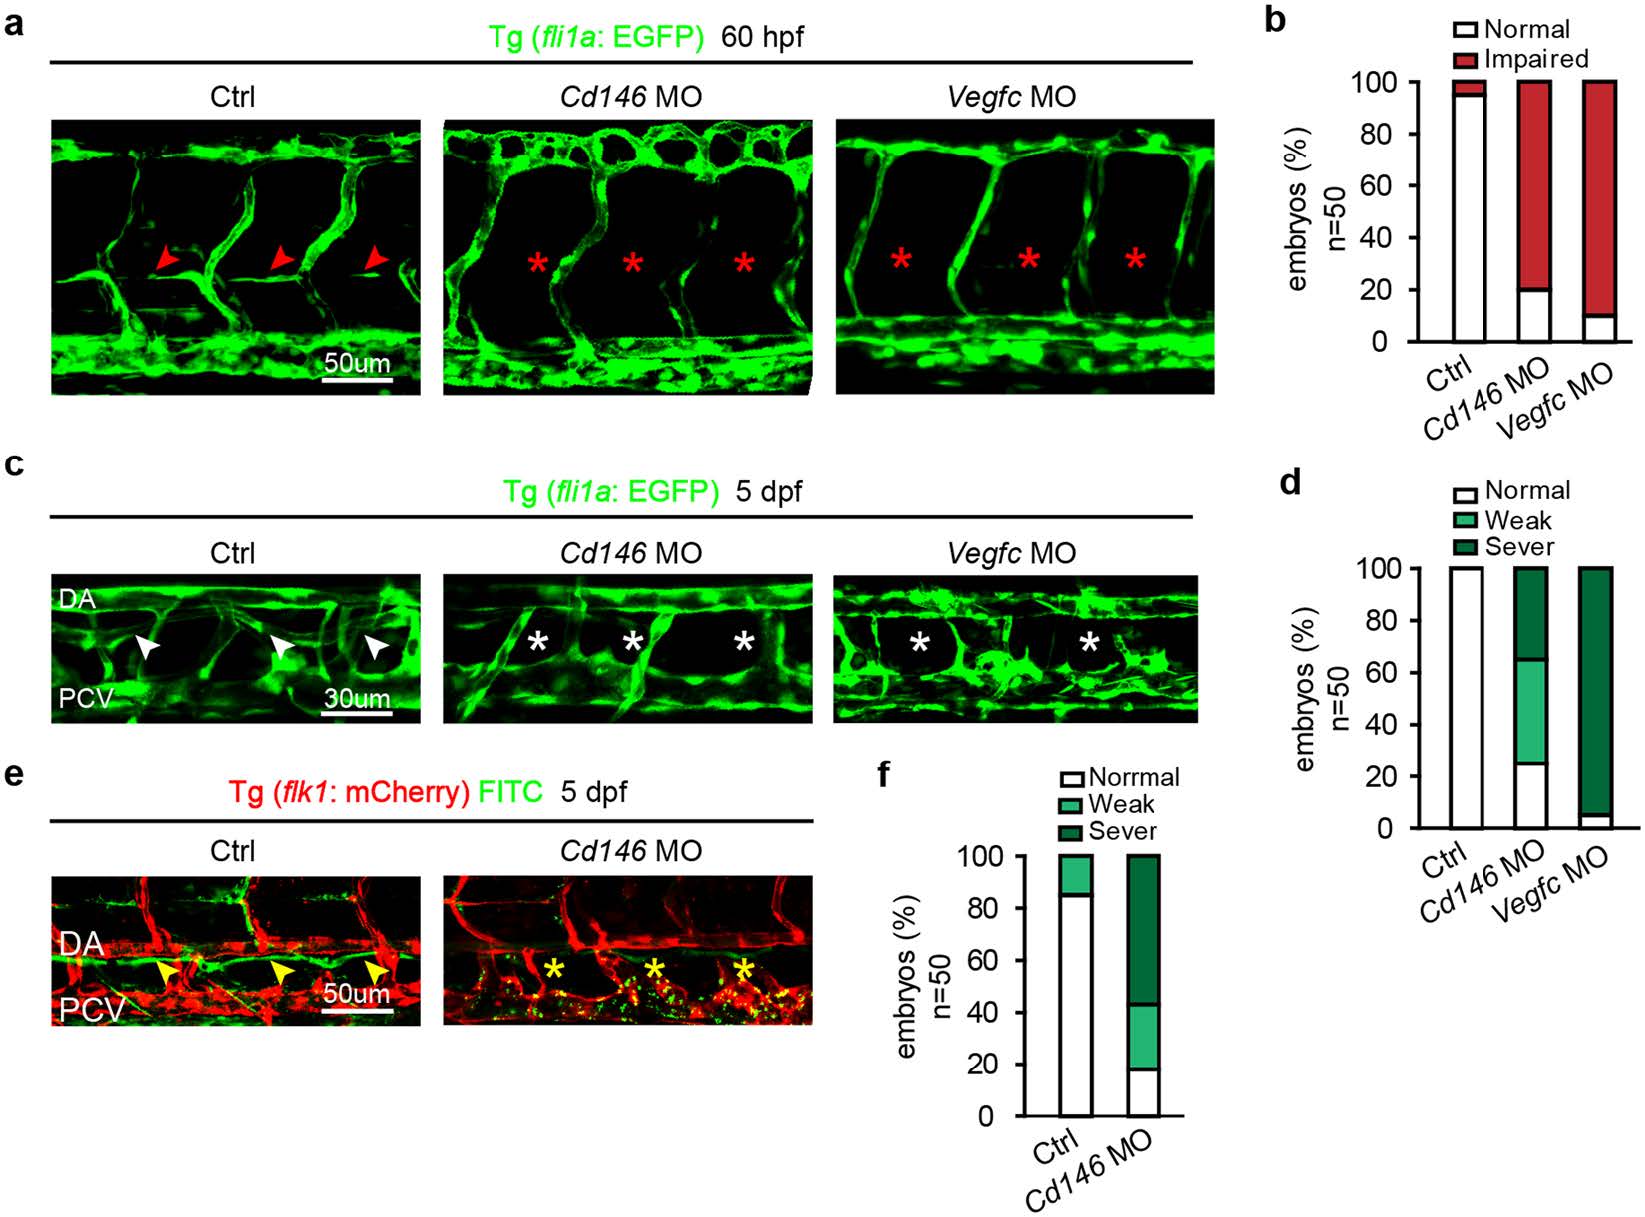
Knockdown of CD146 disrupts lymphangiogenesis in zebrafish. (a,b) The effects of cd146 or vegfc knockdown on PL formation. Tg (fli1a: EGFP) embryos, injected with control, cd146 or vegfc specific MO, were harvested at 60 hpf. Confocal images showed normal PL (red arrows) and impaired PL (red stars) in (a). Scale bars: 50 μm. The percentages of embryos with normal PL cells (normal) and impaired PL string formation (impaired PLs) were shown in (b). (c,d) The effects of cd146 or vegfc knockdown on TD formation. Tg (fli1a: EGFP) embryos, injected with control, cd146 or vegfc specific MO, were harvested at 5 dpf. Confocal images showed normal TD (white arrows) and abnormal TD (white stars) in (c). Scale bars: 30 μm. The percentages of embryos with different phenotypes of TD formation were shown in (d). Relative to the normal embryos, the TD length decreased to 30–90% were classified as weak, and those decreased to 10–30% were classified as severe. (e,f) The effects of cd146 knockdown on TD function. Tg (flk1: mcherry) zebrafish embryos injected with control or cd146 specific MO and FITC-dextran was injected subcutaneously in the tail of those fishes. The embryos were harvested at 5 dpf. Confocal images showed functional TD (yellow arrows) and dysfunctional TD (yellow stars) in (e). Scale bars: 50 μm. The percentages of embryos with different phenotypes of TD formation were shown in (f). The criterion used to classify the TD formation was the same as that used in (d). In all panels, the head of the embryo faces left and dorsal is up.