
Fig. S5
- ID
- ZDB-IMAGE-180123-33
- Genes
- Publication
- Yan et al., 2017 - CD146 is required for VEGF-C-induced lymphatic sprouting during lymphangiogenesis
- All Figures
- Figures for Yan et al., 2017
|
Fig. S5
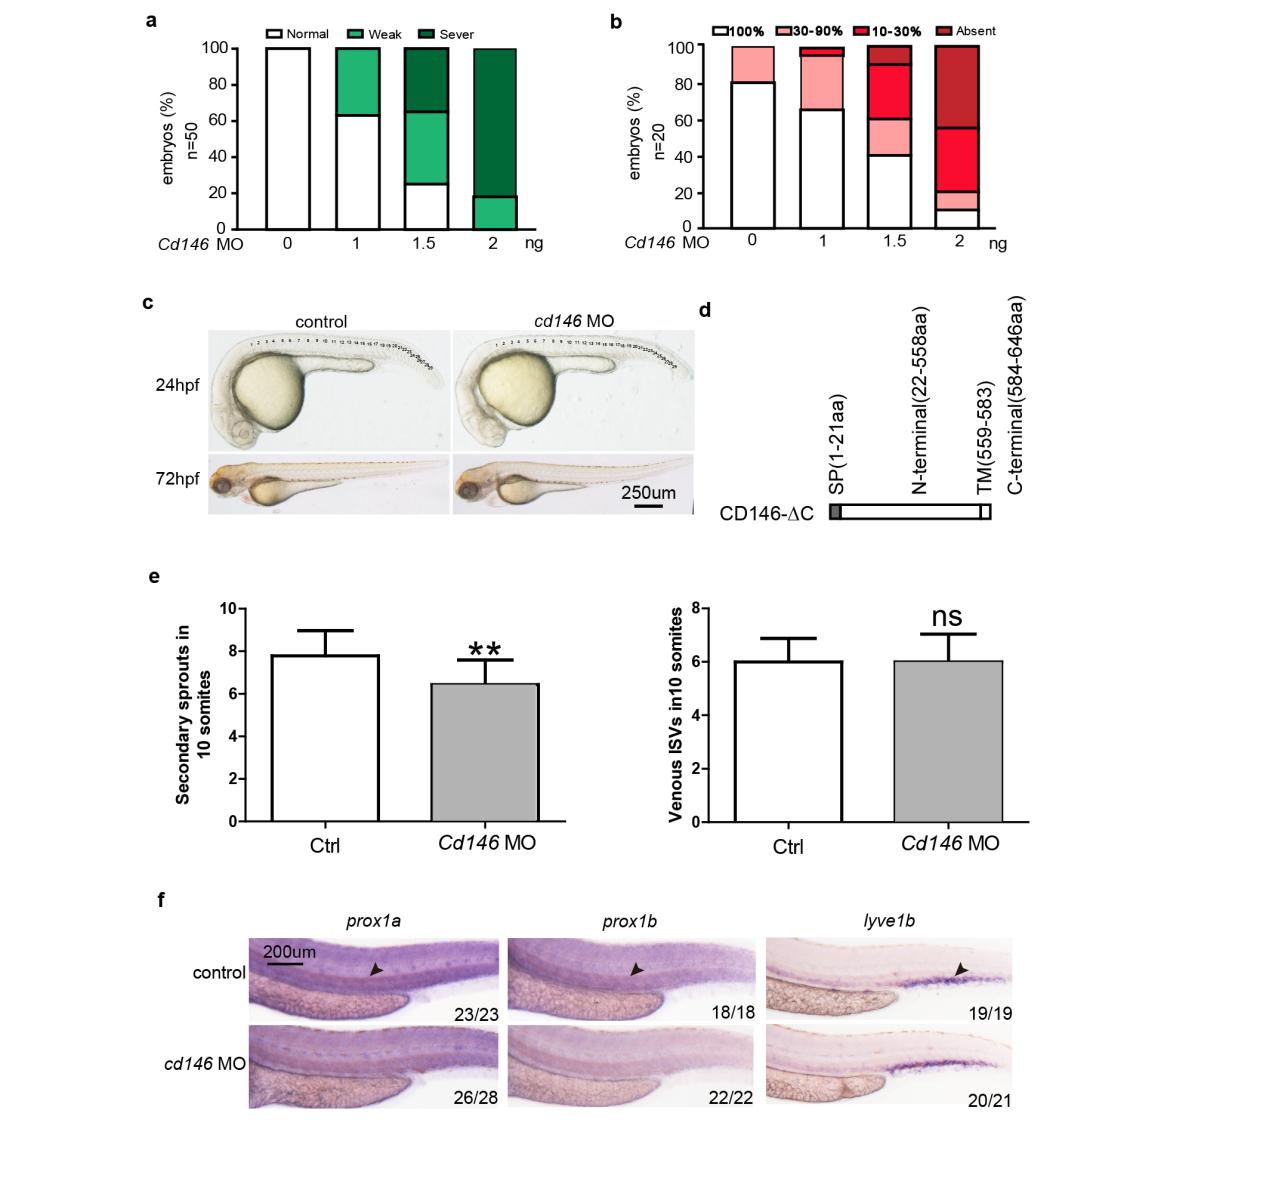
Knockdown of CD146 disrupts PL and TD formation in zebrafish. (a) Quantification of the TD formation defects after injection of different dose of cd146 MO at 5 dpf. Relative to the normal embryos, the TD length decreased to 30%-90% were classified as weak, and those decreased to 10%-30% were classified as sever. (b) Quantification of the PL formation defects after injection of different dose of cd146 MO at 60 hpf. Percentages of embryos displaying complete lack of PL, PL formation over 10%-30% or 30%-90% of its normal length, and a normal PL were represented for each treatment group. (c) The effect of knockdown cd146 on morphology of zebrafish embryo at 24hpf and 72hpf. Bright-field side views of the whole embryos injected with control or cd146 specific MO. Scale bars: 250 μm. (d) Diagrammatic representation of C-terminal domain deleted CD146. (e) Quantificaiton of the number of unilateral secondary sprouts (left) and the fraction of venous ISVs, identified by their connection to the PCV upon confocal screening. **, P<0.05, compared with control group. (f) The effect of knockdown cd146 on lymphatic vessels. Bright-field side views of the trunk of embryos injected with control or CD146 specific MO. Embryos were stained by WISH for a panel of lymphatic markers of prox1a, prox1b and lyve1b. Black arrows, TD. Scale bars: 200 μm.