
Image
|
Figure Caption
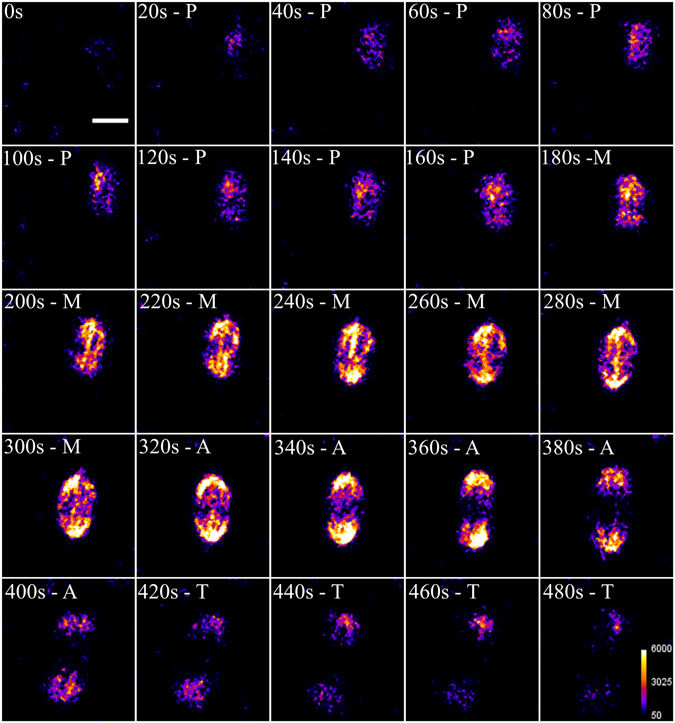
Fig. 1
Time-lapse SHG imaging of mitotic spindles during mitotic division of a zebrafish embryo. Prometaphase (P; 20–160 s), metaphase (M; 180–300 s), anaphase (320–400 s) and telophase (420–480 s). Average power at focus: 150 mW, photomultiplier tube set at 1100 V. Scale bar: 10 µm.
Acknowledgments
This image is the copyrighted work of the attributed author or publisher, and
ZFIN has permission only to display this image to its users.
Additional permissions should be obtained from the applicable author or publisher of the image.
Full text @ Sci. Rep.