
Fig. 6
- ID
- ZDB-IMAGE-180118-26
- Genes
- Publication
- Bayramli et al., 2017 - Patterned Arrangements of Olfactory Receptor Gene Expression in Zebrafish are Established by Radial Movement of Specified Olfactory Sensory Neurons
- All Figures
- Figures for Bayramli et al., 2017
|
Fig. 6
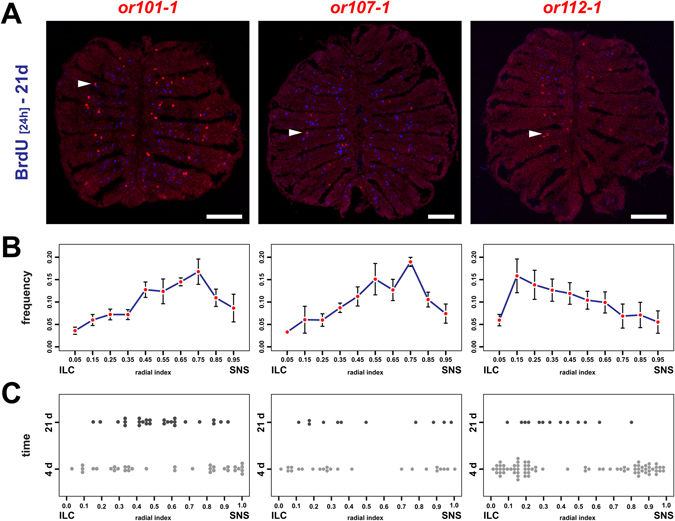
OSNs continue to undergo positional shifts after onset of OR expression. (A) Immunohistochemistry against BrdU (blue) on cross sections through the OE of adult zebrafish that were incubated for 24 h in BrdU 21d prior to analysis and simultaneous in situ-hybridization (red) for the three olfactory receptors or101-1 (left), or107-1 (centre), and or112-1 (right). For each receptor BrdU double-positive cells (arrowheads) can be identified. Scale bar: 100 µm. (B) OR frequency distribution profiles across the radial dimension of the OE for the receptors shown in A (left: or101-1, centre: or107-1, right: or112-1). The position of each cell was normalized to the distance of the sensory/nonsensory border (SNS) from the tips of the interlamellar curves (ILCs). The data represent the positions (mean ± SEM) of: or101-1: 755 cells from 4 OEs of 4 fish, or107-1: 332 cells from 4 OEs of 4 fish, and or112-1: 464 cells from 6 OEs of 3 fish. (C) Spatial distribution of young (4d, light grey) and old (21d, dark grey) OSNs expressing or101-1 (left), or 107-1 (centre), and or112-1 (right) normalized to the length of the sensory OE between the tips of the interlamellar curves (ILCs) and the sensory/nonsensory border (SNS). OSNs expressing specific OR genes continue to undergo positional shifts over time.