
|
Fig. 3
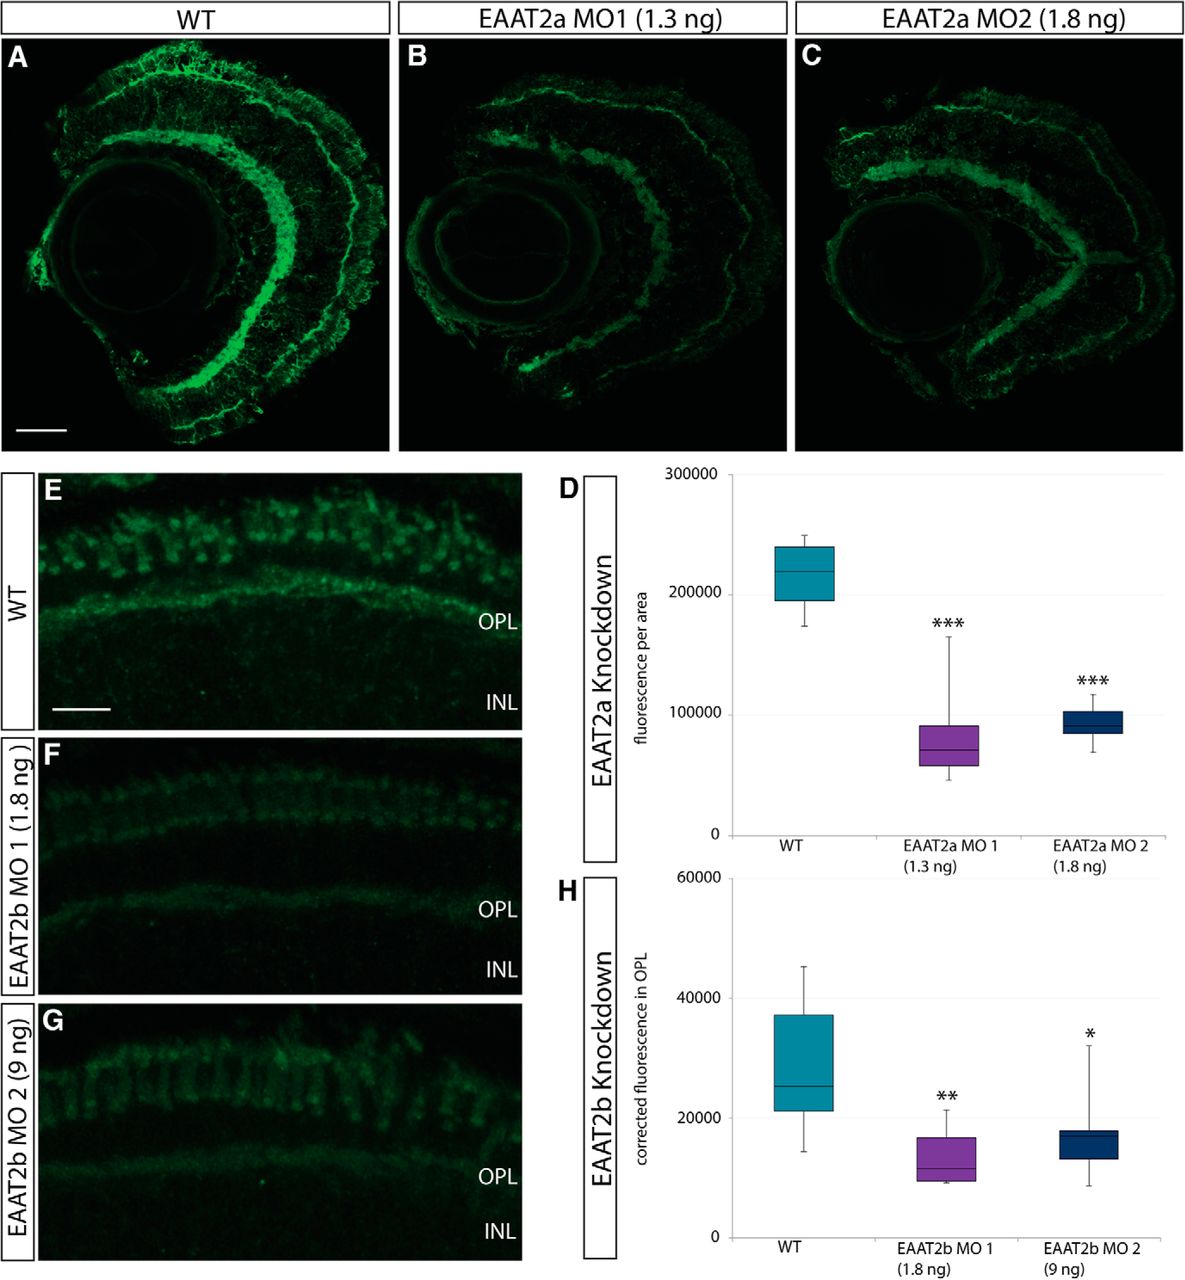
Confirmation of knockdown. A–C, Immunostaining of EAAT2a on WT (A) and EAAT2a morphant [B, 1.3 ng EAAT2a morpholino (MO) 1; C, 1.8 ng EAAT2a MO 2] retinal sections (5 dpf). D, Box-and-whisker plot of analysis of fluorescence of WT, EAAT2a MO 1, and EAAT2a MO 2 injected animals stained with anti-EAAT2a antibody. Statistical analysis reveals a highly significant (p < 0.001) reduction of fluorescence for both MOs. E–G, Retinal sections of WT (E) and EAAT2b morphant (F, 1.8 ng EAAT2b MO 1; G, 9 ng EAAT2b MO 2) larvae stained with anti-EAAT2b antibody. H, Fluorescence was measured in the OPL, and background fluorescence (taken from area in INL) was subtracted. Fluorescence of WT and morphant immunostaining is plotted in a box-and-whisker plot and shows a significant (p < 0.01) and slightly significant (p < 0.05) decrease in fluorescence in animals injected with 1.8 ng EAAT2b MO 1 and 9 ng EAAT2b MO 2, respectively. EAAT2a WT, n = 6; EAAT2a MO 1, n = 8; EAAT2a MO 2, n = 8; EAAT2b WT, n = 10; EAAT2b MO 1, n = 10; EAAT2b MO 2, n = 10. Scale bar in A is 30 μm; also applies to B and C. Scale bar in E is 10 μm; also applies to F and G.