
Fig. 3
- ID
- ZDB-IMAGE-180109-11
- Publication
- Turrini et al., 2017 - Optical mapping of neuronal activity during seizures in zebrafish
- All Figures
- Figures for Turrini et al., 2017
|
Fig. 3
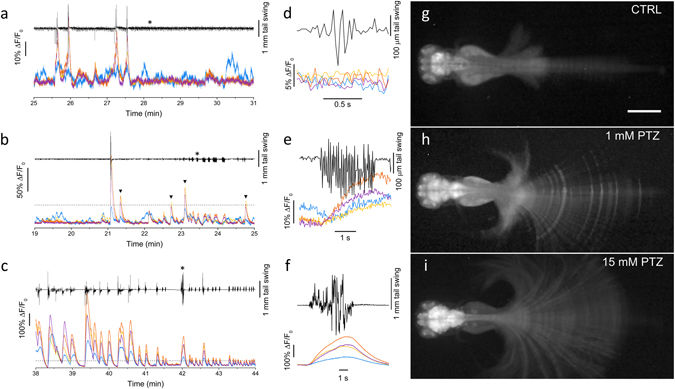
Simultaneous measurement of brain activity and tail movement. (a) Time trace of tail movement (black line) and fluorescence (ΔF/F0) analysed in control conditions (0 mM PTZ) for four brain regions color-coded as in Fig. 1a. The traces show correlations between fluorescence peaks and tail movements for optic tectum, cerebellum and medulla, while the telencephalon exhibits some degree of activity not correlated with tail movement. (b-c) Tail movement and brain activity analysed as in panel a at 1 and 15 mM PTZ, respectively. The dashed lines show a ΔF/F0 level of 0.4 corresponding to the highest peaks typically measured in control conditions. The arrowheads in panel b highlight peaks overcoming the 0.4 level and not corresponding to large tail movements. (d-e-f) Expanded time scale traces of the fragment indicated by the asterisk in a, b and c, respectively. Each panel shows movement and fluorescence traces (color-coded as in panels a-c) corresponding to a typical tail movement observed in the corresponding condition. (g-h-i) Fluorescence images of head-restrained larvae (see Methods) in 0, 1 and 15 mM PTZ. Images are maximum intensity projections over a time interval of 10 min, chosen during typical locomotor activity of the tested condition. Panels h and i are displayed with gamma = 0.4 to avoid saturation in the encephalon and still have good contrast on the tail. Scale bar 500 µm.