
Image
|
Figure Caption
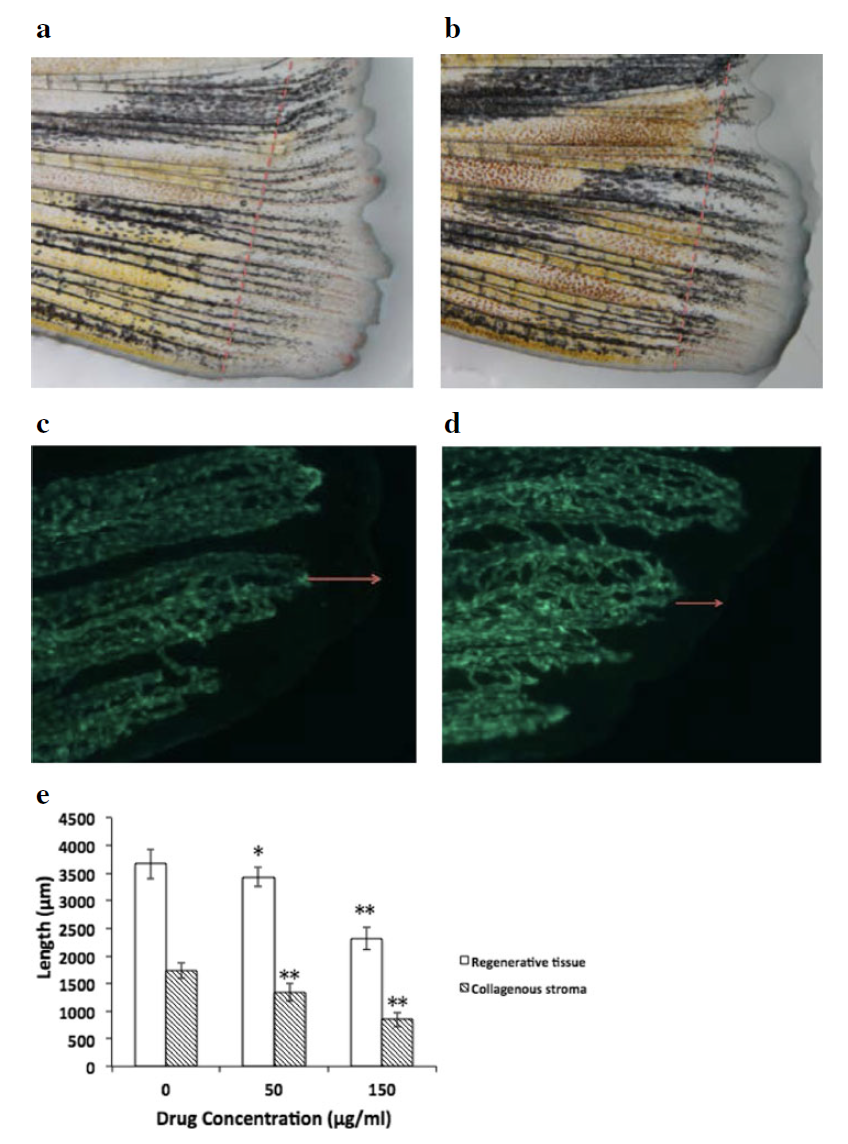
Fig. 8
Antiangiogenic effect of oridonin in adult zebrafish. The average lengths of the regenerated tissues were measured and calculated. a control group (regular light); b 150 μg/ml oridonin group (regular light); c control group (fluorescent light); d 150 μg/ml oridonin group (fluorescent light); e Length comparison. The asterisks indicate statistically significant differences from the control group (*P < 0.05, **P < 0.01)
Acknowledgments
This image is the copyrighted work of the attributed author or publisher, and
ZFIN has permission only to display this image to its users.
Additional permissions should be obtained from the applicable author or publisher of the image.
Full text @ BMC Complement Altern Med