
Image
|
Figure Caption
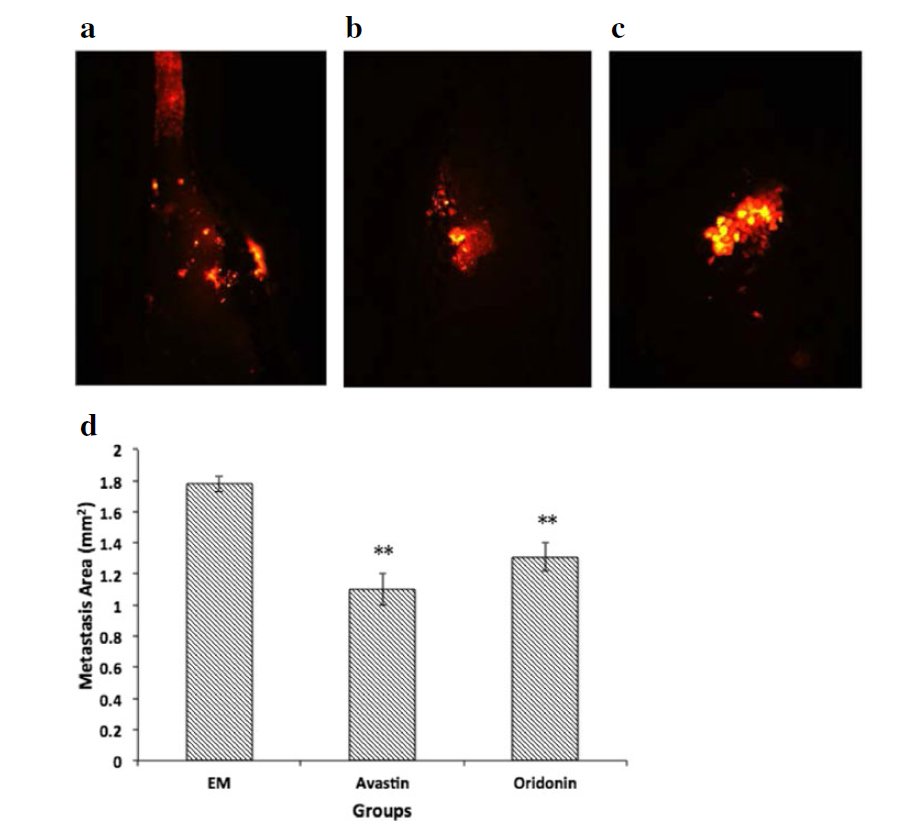
Fig. 10
Tumour metastasis in xenograft zebrafish after 7 d exposure to EM, Avastin, and oridonin. a blank control group (EM); b positive control group (Avastin); c the group (oridonin); d Metastasis area comparison. The asterisks indicate statistically significant differences from the control group (**P < 0.01)
Acknowledgments
This image is the copyrighted work of the attributed author or publisher, and
ZFIN has permission only to display this image to its users.
Additional permissions should be obtained from the applicable author or publisher of the image.
Full text @ BMC Complement Altern Med