
|
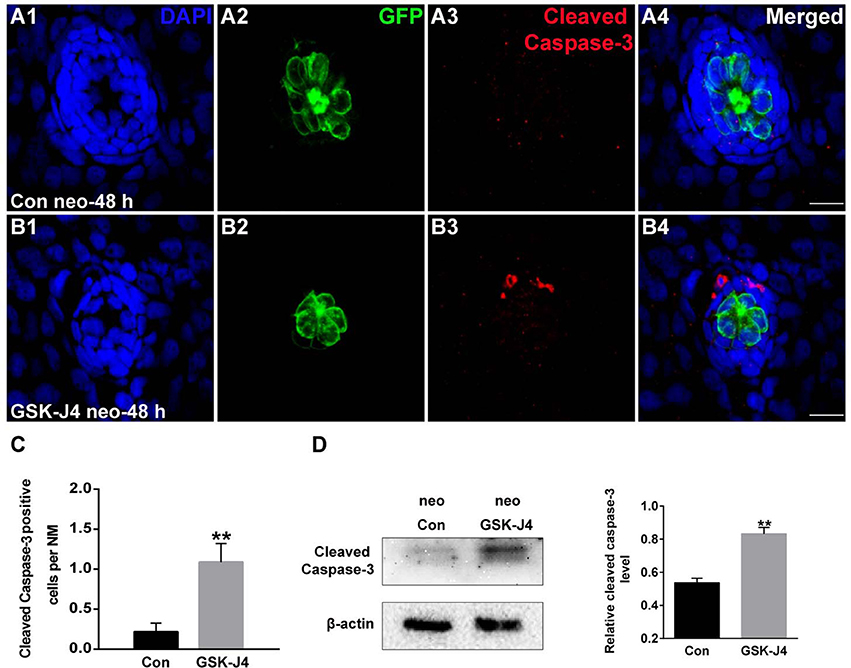
Fig. 3
GSK-J4 induced apoptosis in the regenerating neuromasts. (A,B) Cleaved caspase-3 staining in the neuromasts from a DMSO-treated control larva (A) and a GSK-J4-treated larva (B) at 48 h after neomycin damage. Scale bar = 10 μm. (C) Quantitative analysis of the number of cleaved caspase-3-labeled cells in DMSO-treated control and GSK-J4-treated larvae. n = 24 neuromasts (12 larvae) per group. **p < 0.001 (unpaired t-test, two-tailed, t = 3.368, df = 44, p = 0.0016). (D) Cleaved-caspase-3-specific western blot analysis of whole larvae treated with either DMSO (neo Con; n = 6 larvae) or 10 μM GSK-J4 (neo GSK-J4; n = 6 larvae) for 48 h. The relative expressions of cleaved-caspase-3/β-actin were calculated. **p < 0.001.