
|
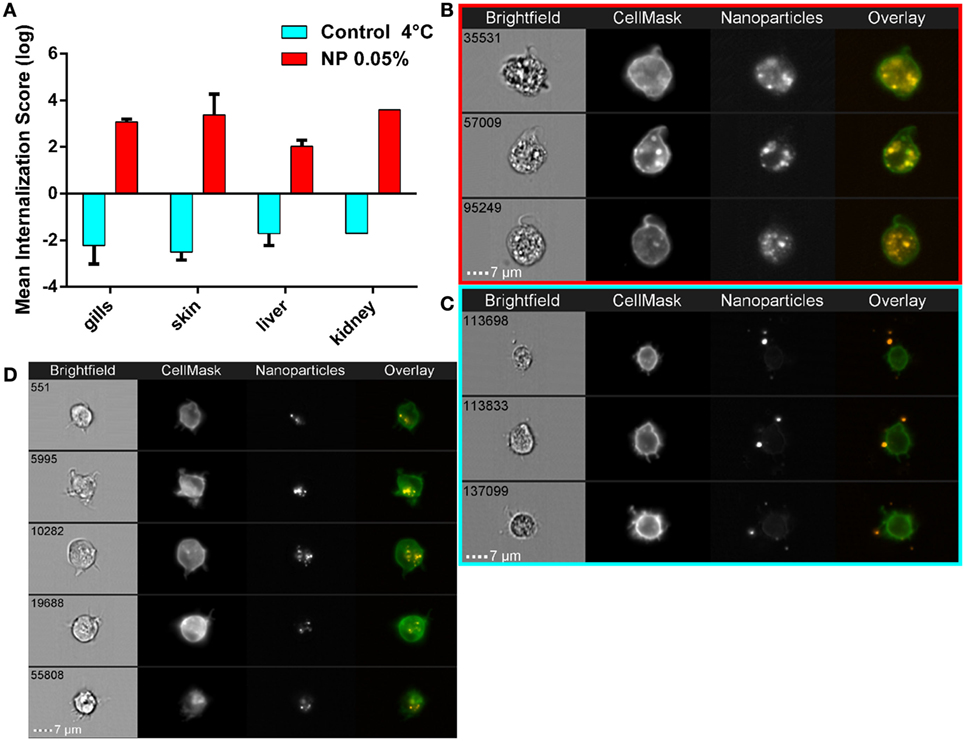
Fig. 5
Active nanoparticles (NPs) internalization in cells of mucosae, kidneys, and liver. (A) NP internalization score, assessed by imaging in flow, in dissected organs from adult zebrafish exposed to 0.05% red fluorescent NPs (red histograms). As a negative control for internalization (blue histograms), PLA-NPs were added at 4°C just before acquisition on the cell suspension from fish unexposed to NP. Whereas most NPs are found at or outside the cell membrane in the negative controls (internalization scores <−1), a high majority of NPs is detected inside the cells of NP-treated fish (internalization scores >2) in all analyzed organs. (B–D) Representative images of NPs in kidney (B,C) or gill (D) cell suspensions, from NP-exposed fish (B,D) or control conditions (C), which display membrane processes reminiscent of dendrites. Total number of analyzed cells (NP 0.05%/4°C control): gills (three independent acquisitions) 1312/4355, skin (two independent acquisitions) 345/4185, liver (two independent acquisitions) 1431/2651, and kidney (one acquisition) 117/3180. One fish per acquisition. Error bars: SD.