
Fig. S3
- ID
- ZDB-IMAGE-171227-43
- Publication
- Pimtong et al., 2014 - Drl.3 governs primitive hematopoiesis in zebrafish
- All Figures
- Figures for Pimtong et al., 2014
|
Fig. S3
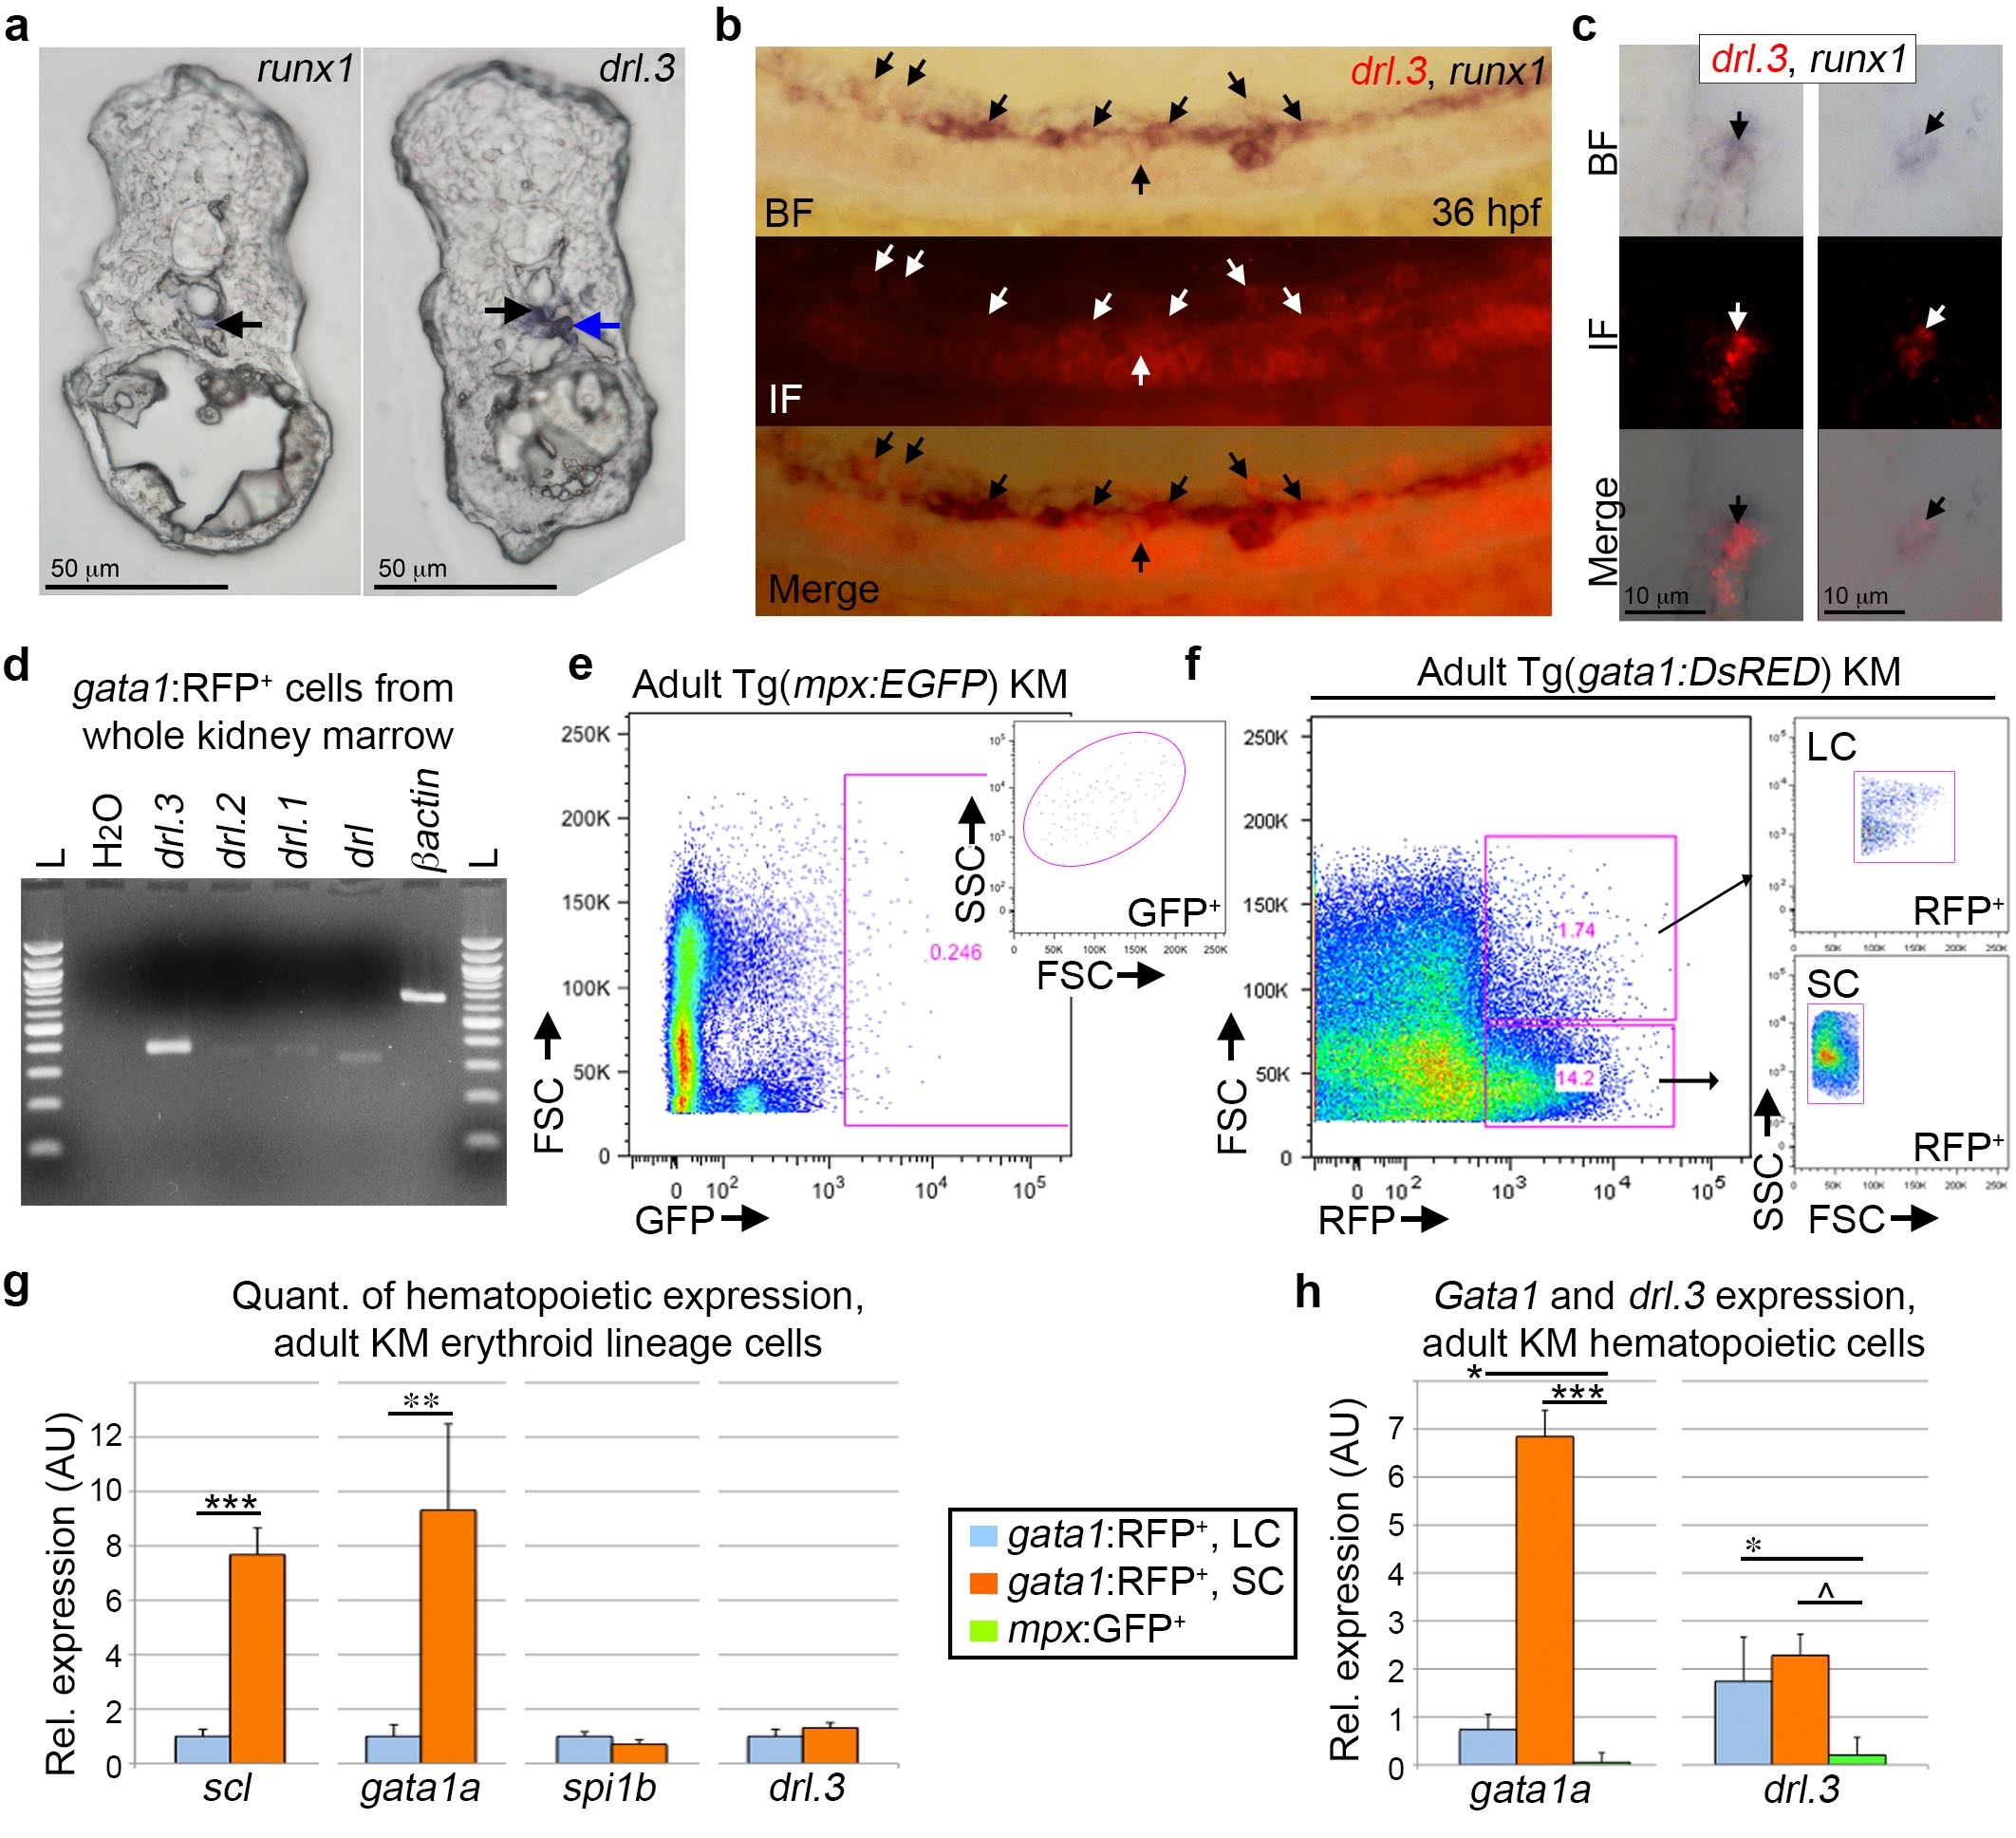
Drl.3 is expressed in definitive and adult hematopoietic cells.
(a) Transverse sections of 28 hpf embryos showing runx1 (left) and drl.3 (right) WISH-positive cells (arrows). Cells in the ventral wall of the aorta are indicated by black arrows. (b-c) WISH analysis of runx1 (blue) and drl.3 (red) in the AGM region of 36 hpf embryos. Runx1 was visualized with NBCIP/NBT (purple), drl.3 by Fast Red alkaline phosphatase substrate. Fast Red precipitate was used to fluorescently visualize drl.3 transcripts. Arrows indicate coexpressing cells. (b) Lateral whole mount views and (c) 8 micron transverse sections showing brightfield (BF, top), fluorescent (IF, middle) and BF/IF overlaid (Merge, bottom) images. (d) Ori family member expression in gata1:GFP+ cells (small sized) purified from adult kidney marrow. (e-f) FAGS analysis of mpx:GFP+ (e) and gata1:RFP+ (f) cells from adult whole kidney marrow (KM). FSC-SSC plots are shown for the fluorescent populations. (g) Real time PCR quantification of scl, gata1a, spi1b and drl.3 expression in gata1:RFP+ large cells (LC) and small cells (SC) from adult KM. ***P = 0.0003, **P = 0.0097. (h) Real time PCR quantification of gata1 and drl.3 expression in gata1:RFP+ and mpx:GFP+ populations as indicated. *P= 0.0425, ***P= 3.78E-05, *P= 0.0115, ^P= 0.0221. Significance was determined using the Student's t-test.