
Fig. 3
- ID
- ZDB-IMAGE-171227-3
- Genes
- Publication
- Shao et al., 2017 - Vegetally localised Vrtn functions as a novel repressor to modulate bmp2b transcription during dorsoventral patterning in zebrafish.
- All Figures
- Figures for Shao et al., 2017
|
Fig. 3
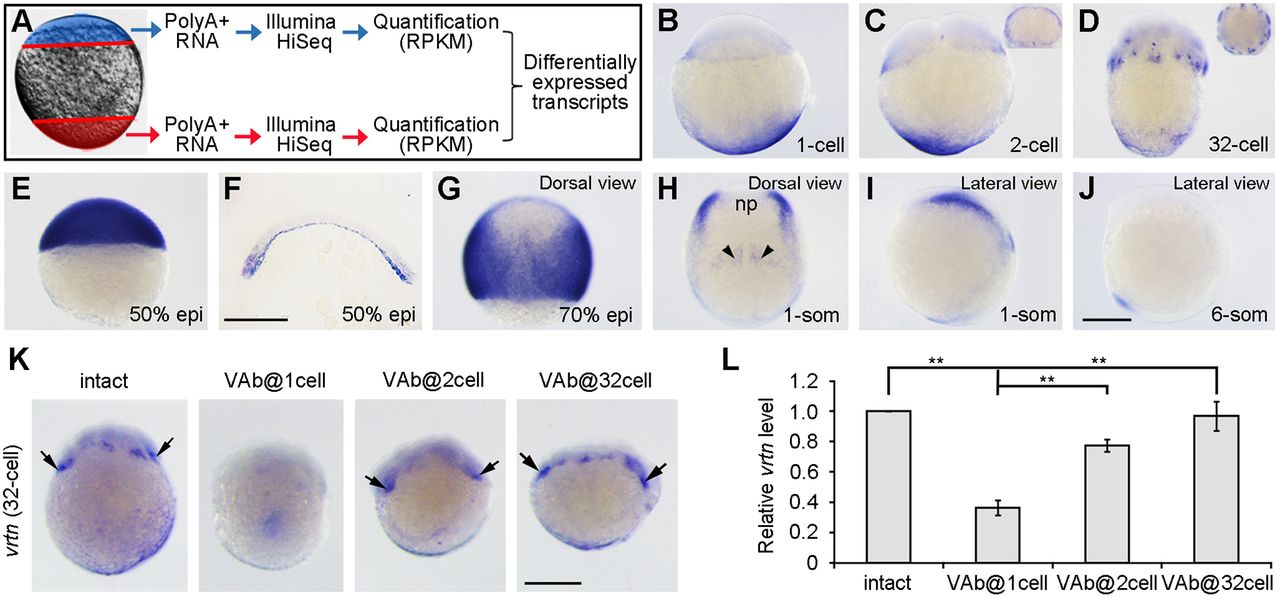
Identification of vegetally localised vrtn transcripts. (A) Procedure for the identification of vegetal pole-enriched transcripts. (B) Maternal vrtn transcripts are localised to the vegetal pole region in the fertilised egg. (C) At the two-cell stage, vrtn transcripts are detected in the marginal region. The inset is an animal pole view. (D) At the 32-cell stage, most vrtn transcripts are localised in the marginal region, as shown by the animal pole view (inset). (E) Strong vrtn expression in the blastoderm at 50% epiboly. (F) Vertical section showing marginal and YSL expression of vrtn at 50% epiboly. (G) Dorsal view at 70% epiboly shows strong vrtn expression in the lateral region. (H,I) Dorsal and lateral views show vrtn expression in the neural plate boundary (np) and forming somites (arrowheads) at the one-somite stage. (J) Lateral view shows vrtn expression in the tail-bud at the six-somite stage. (K) Analysis by in situ hybridisation of vrtn expression following VAb at indicated stages. Arrows indicate the marginal accumulation of maternal vrtn transcripts. (L) Analysis by qRT-PCR of vrtn levels. The relative vrtn level in intact embryos is normalised as 1; data are mean±s.d. from three independent experiments. Scale bars: 250 µm.