
IMAGE
Fig. S5
- ID
- ZDB-IMAGE-171208-3
- Publication
- Lu et al., 2015 - Direct regulation of p53 by miR-142a-3p mediates the survival of hematopoietic stem and progenitor cells in zebrafish
- All Figures
- Figures for Lu et al., 2015
Image
|
Figure Caption
Fig. S5
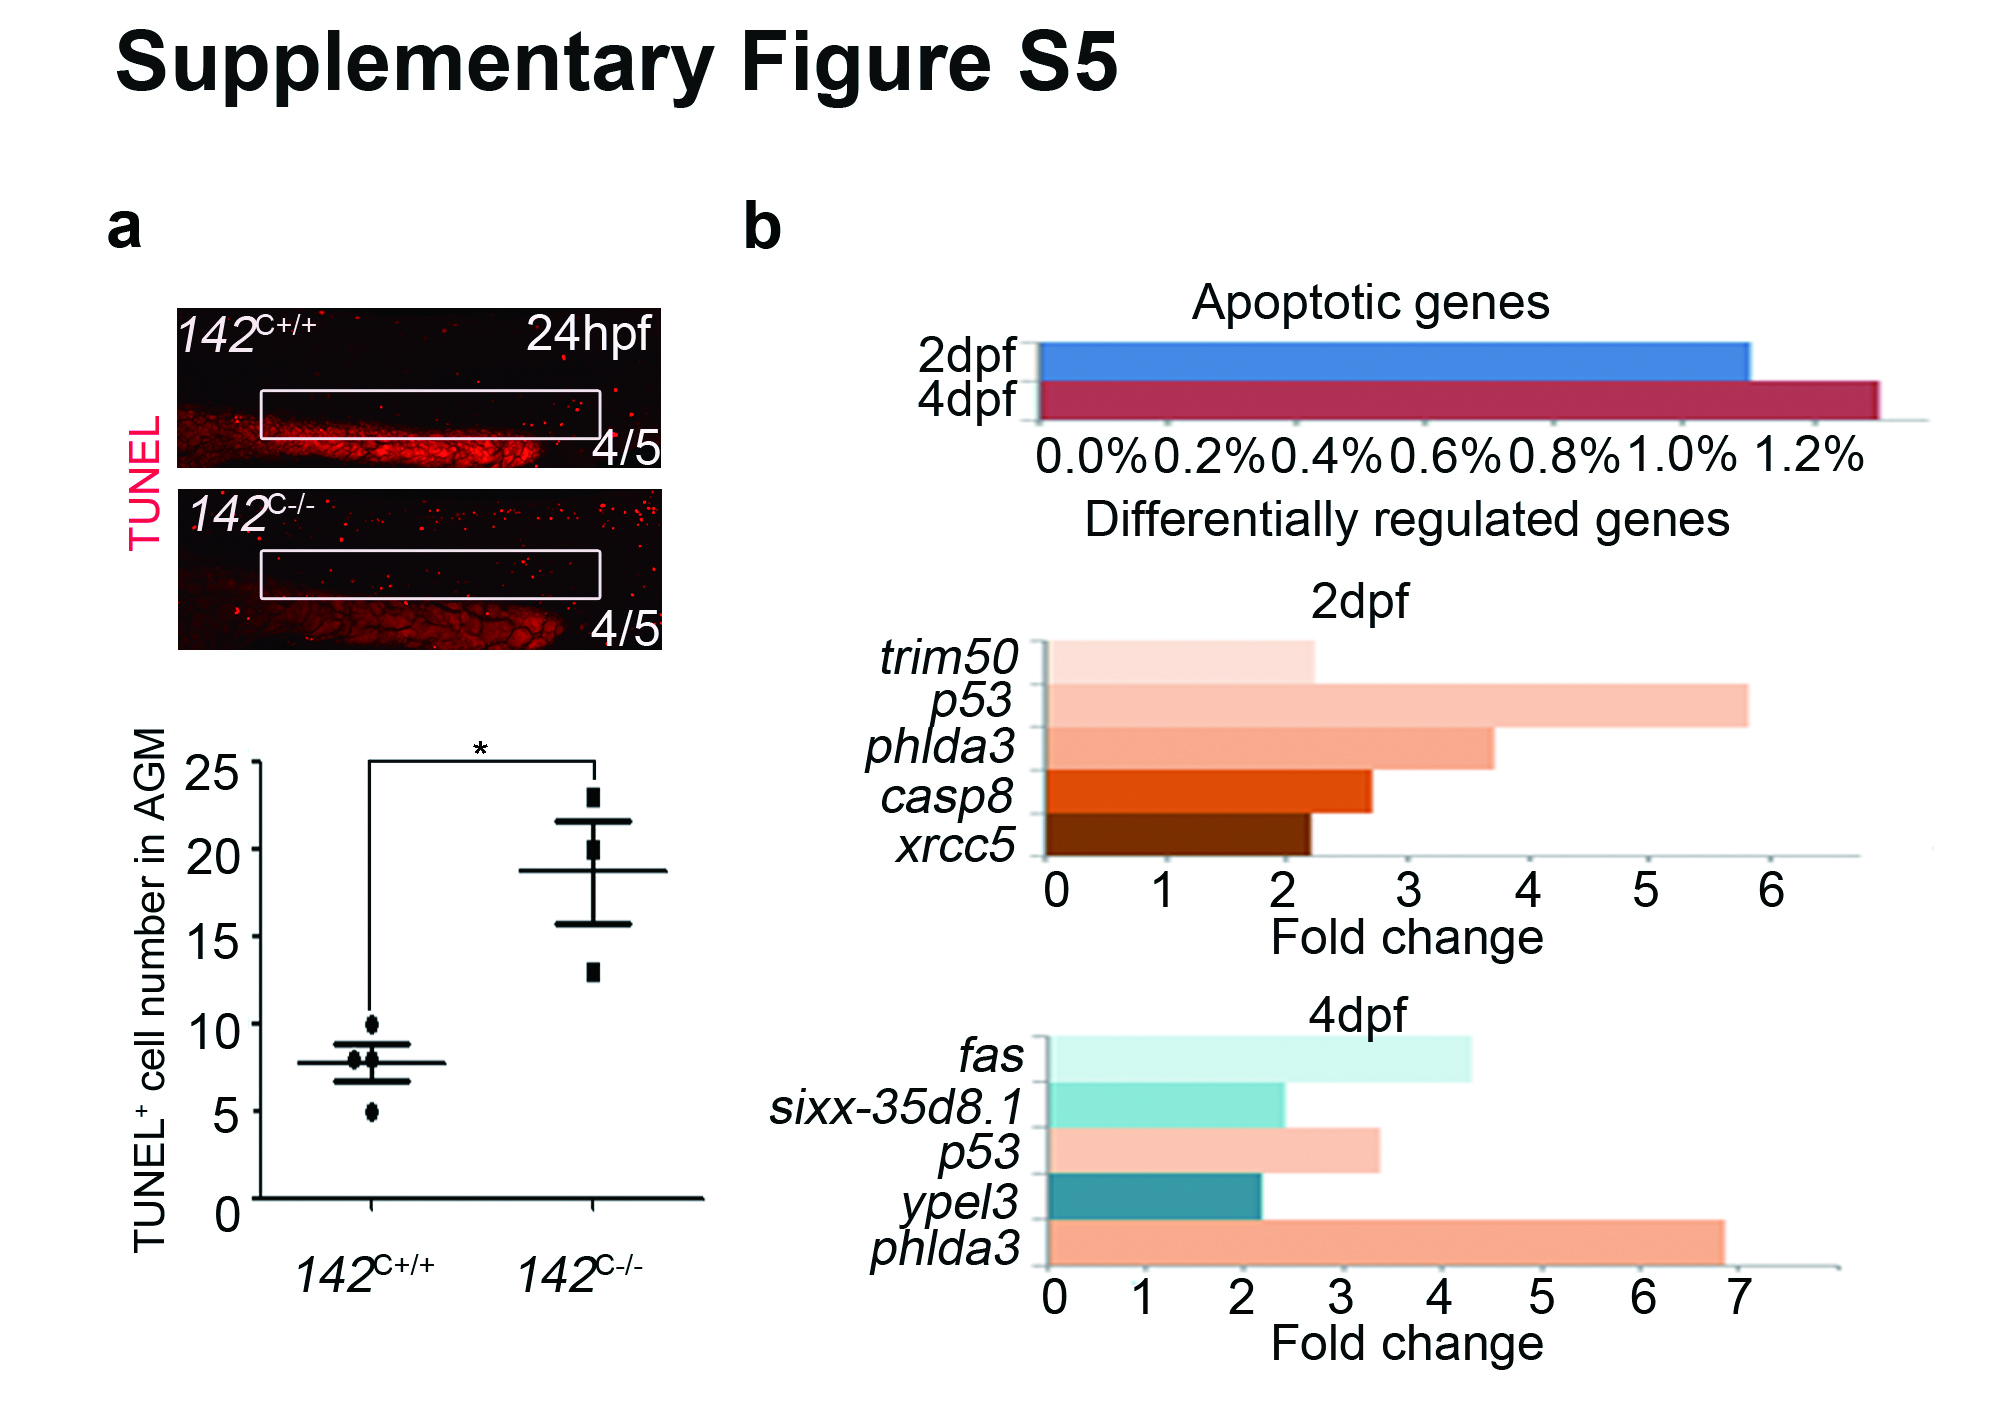
Increased apoptosis in 142C-/- embryos and upregulated expression of apoptotic genes upon knock down of miR-142a-3p.
(a) TUNEL assay displayed more apoptotic cells in the AGM region of 142C-/- embryos. The number was quantified according to the TUNEL positive cells in the AGM region (mean±SD, n=3, *P<0.05). (b) Microarray analysis revealed that apoptotic genes represented by different colors of graph bar including trim50, p53, phlda3, caspase8, xrcc5, fas, sixx-35d8.1, and ypel3 were increased in the miR-142a-3p morphants at 2 and 4 dpf.
Acknowledgments
This image is the copyrighted work of the attributed author or publisher, and
ZFIN has permission only to display this image to its users.
Additional permissions should be obtained from the applicable author or publisher of the image.
Full text @ Cell Discov